Your Team is Working Hard.
Will You Hit the Deadline?

Your Jira board shows what's happening today. Project Commander shows you what's coming — so you can fix problems before they become crises.

Jira Cloud · Scrum or hybrid · Story points or time estimates

📊
Is the plan feasible?
🚨
Is the plan up to date?
📈
Are we on track?
🎲
What are the risks?
Without Project Commander
  • Find out you're late on the day the sprint ends
  • Scope creeps in and nobody notices
  • "Will we make it?" — "I think so"
With Project Commander
  • See the slip coming three sprints early
  • Know exactly where and when scope grew
  • "Will we make it?" — "85% chance by March 15"

Built for project managers, scrum masters, and engineering leads who need to answer hard questions about delivery — not just track tickets.

You committed to a date.
Is it still realistic?

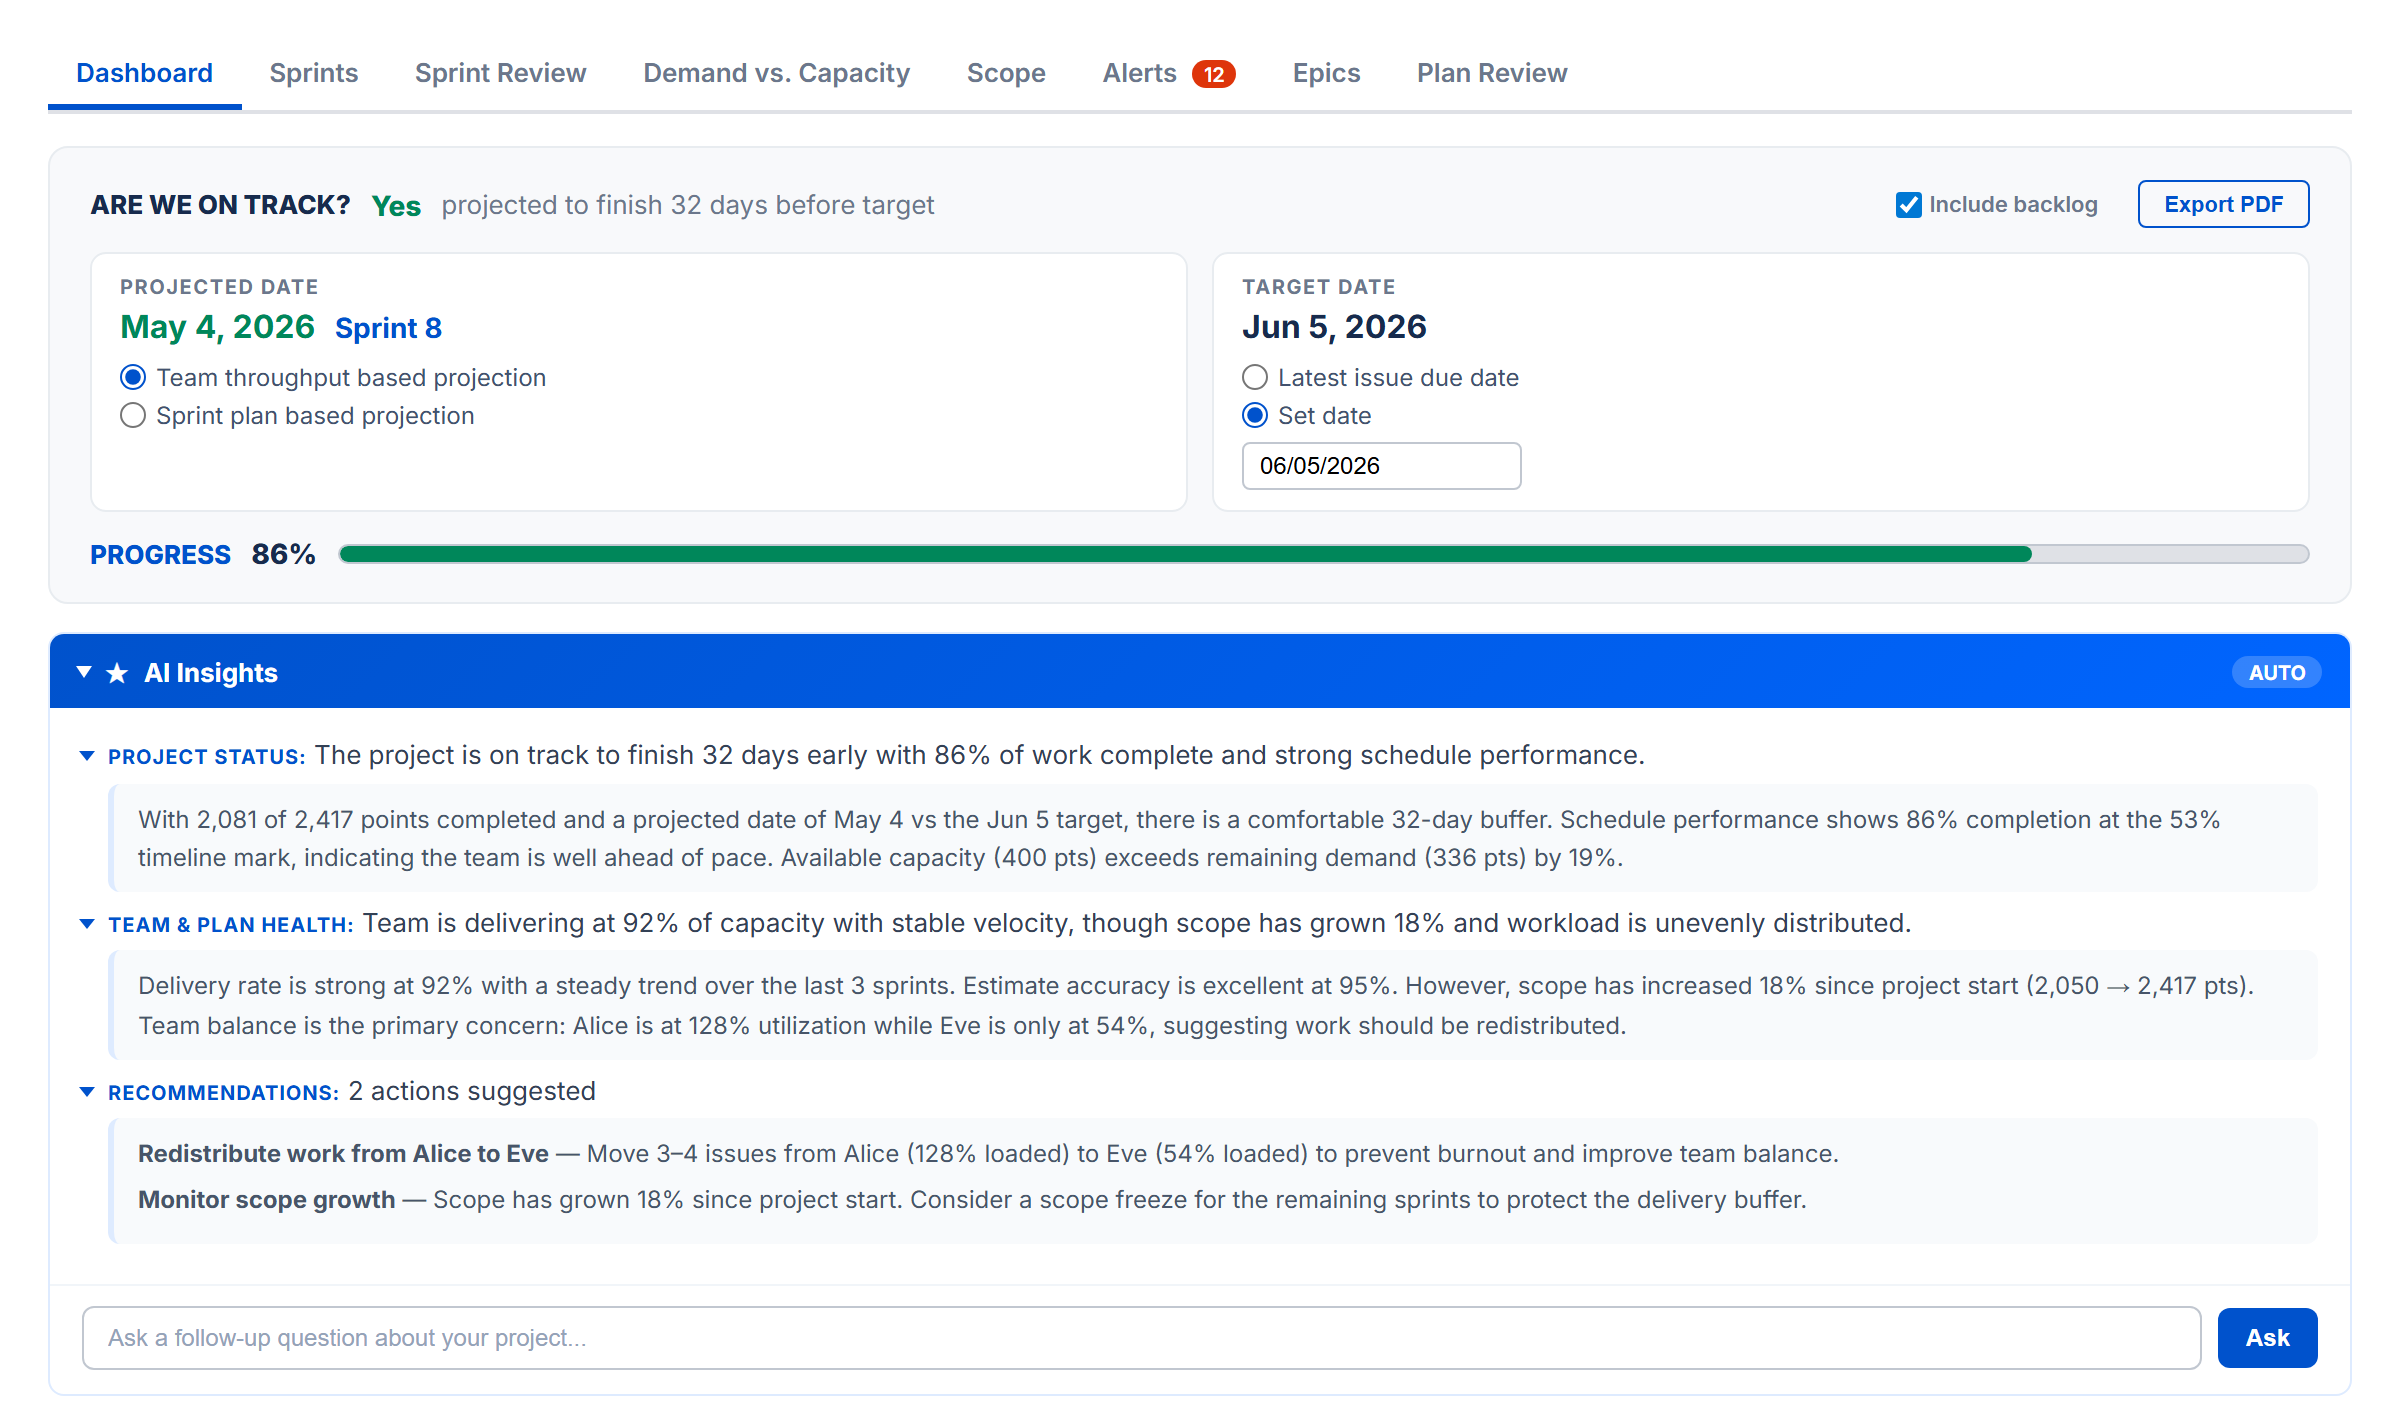
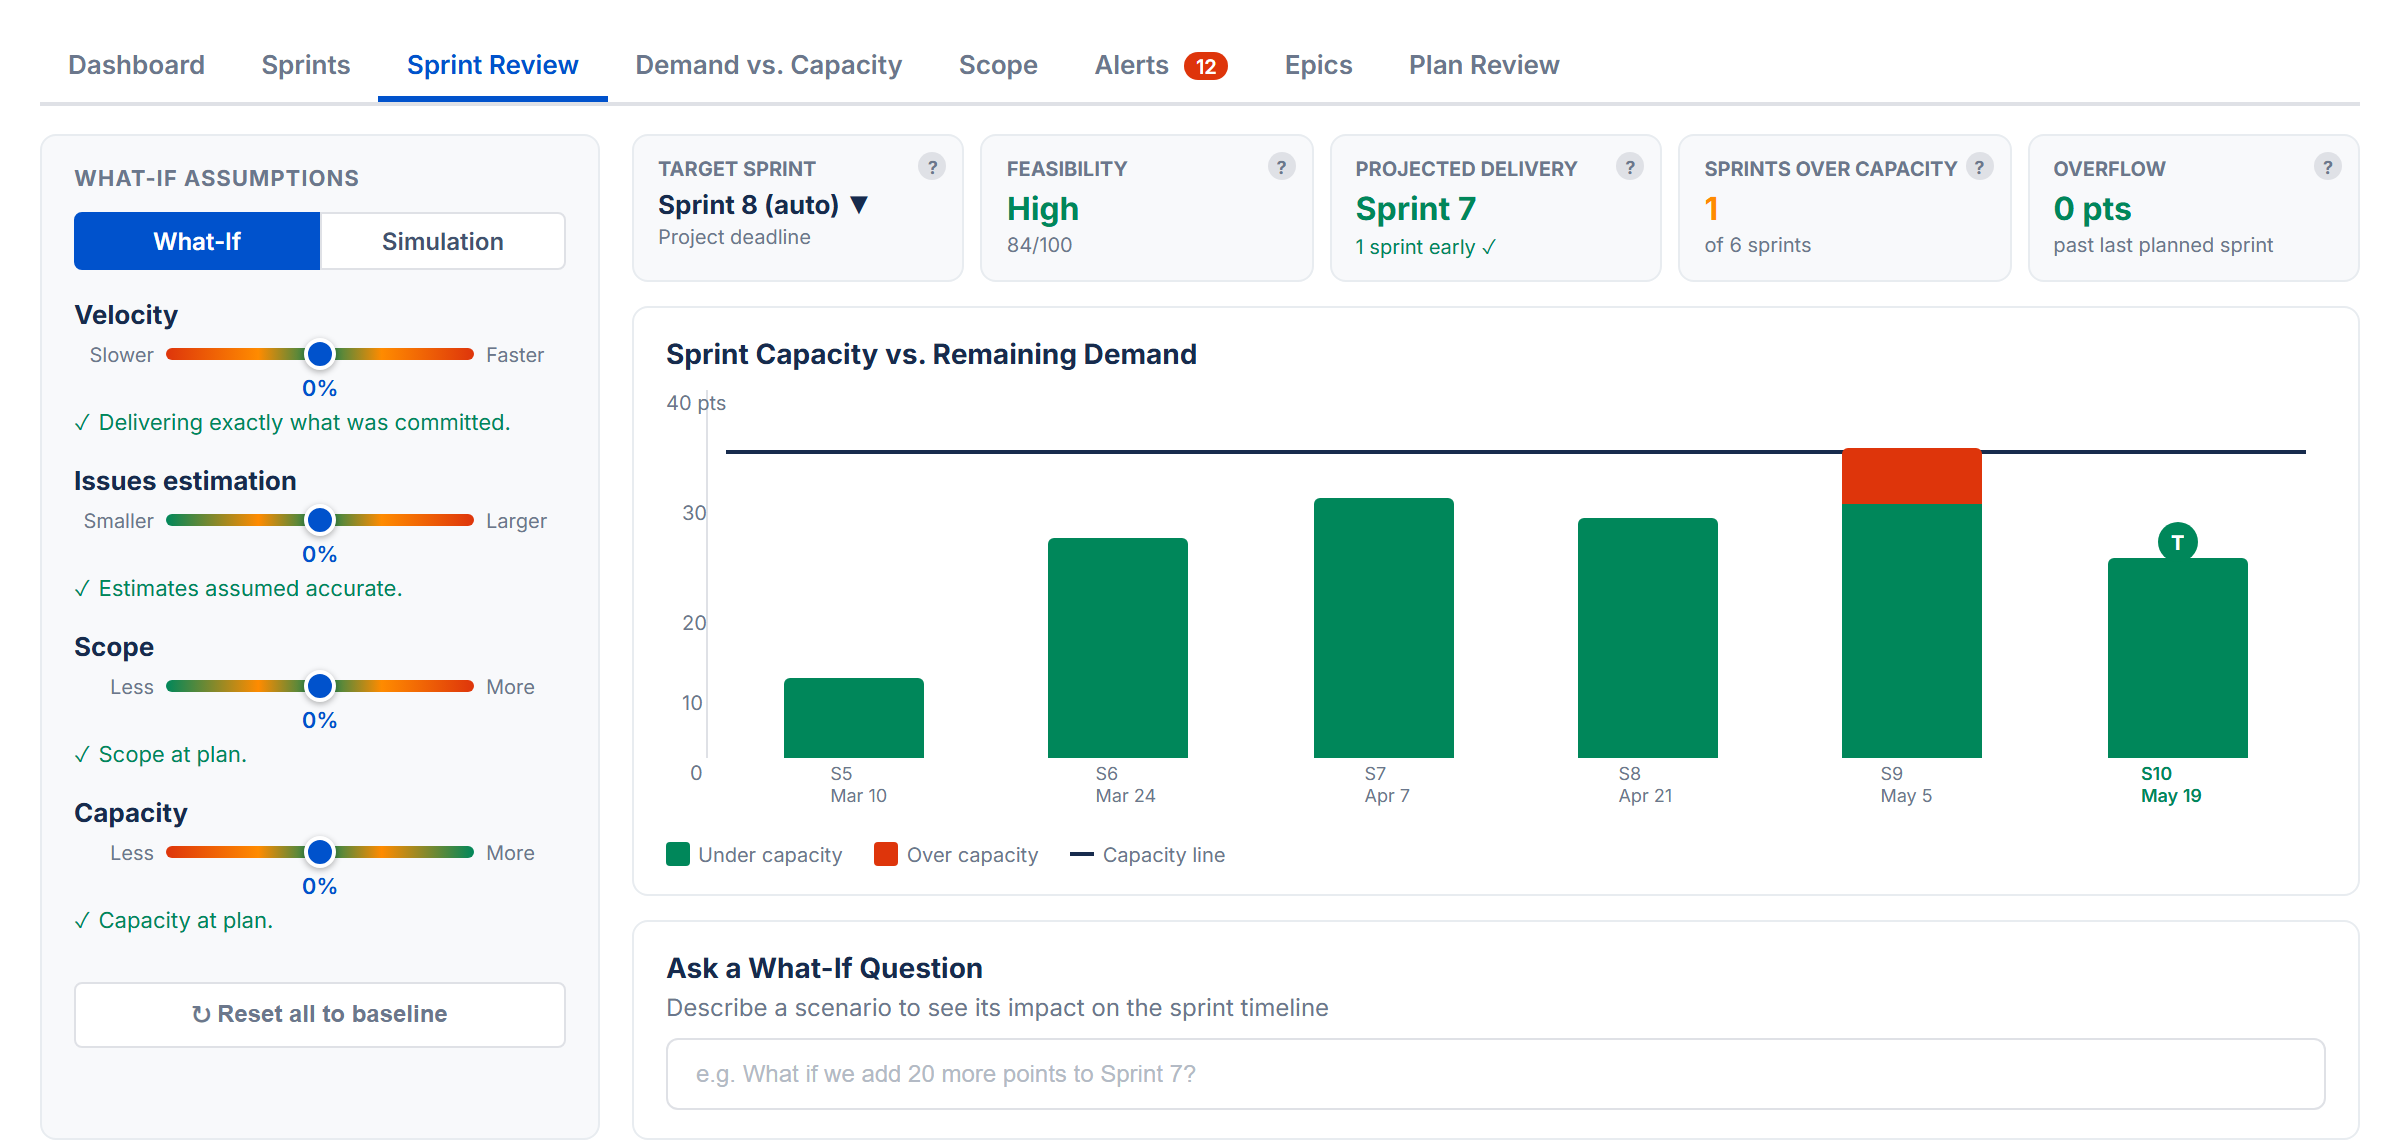
The Dashboard answers one question: "Are we on track?" It compares your projected completion date against your target, shows overall progress, and highlights exactly which factors are green, amber, or red. AI-generated insights summarize the situation and recommend what to do next.

No digging through boards, no guessing. Open the dashboard, get the answer.

Dashboard showing projected vs target date with AI insights

Sprint 14 is overloaded.
Sprint 16 is half empty.

See every sprint's demand vs capacity at a glance. When one sprint is over and another has room, hit Auto-Level and the work redistributes automatically — respecting priorities, dependencies, and per-sprint limits. Don't like the result? Undo with one click.

Stop manually dragging issues between sprints for an hour every Monday.

Sprint planning view with Auto-Level button and capacity bars

Scope keeps growing.
Nobody sees it happening.

The Scope tab tracks total planned work vs completed work over time. When issues get added mid-sprint, you see it immediately — not after the sprint fails. Toggle a delivery forecast to see when work will actually finish based on your team's real velocity.

Scope creep is the silent project killer. Now it's visible.

Scope chart showing planned vs completed work with forecast

Someone is underwater.
Nobody knows.

See every team member's demand vs capacity at a glance. Who's overloaded, who has room, and by how much — with time off and holidays already factored in. Then use Auto-Level to redistribute work across sprints with one click.

Stop burning out your best people while others wait for work.

Team workload showing overloaded, optimal, and available members

How much can your team
actually take on?

Set each person's weekly hours, mark time off on a calendar, add company holidays — and capacity updates everywhere automatically. You always know how many real hours your team has, not just how many people are on the roster.

Capacity planning that accounts for real life.

Team members table with hours, time off, capacity, and demand

You said you'll make it.
Can you prove it?

Run What-If scenarios — adjust velocity, estimation accuracy, scope, and capacity to see how changes affect your delivery date. Then run a Monte Carlo simulation for a probability-based forecast you can show to stakeholders.

Turn "I think we'll make it" into "there's an 85% chance we finish by March 15."

What-If sliders and Monte Carlo simulation

See It in Action

Auto-Level

Redistribute work across sprints with one click — then undo or accept.

What-If & Monte Carlo

Adjust variables and run simulations to forecast delivery probability.

What Else Can It Do?

📋

Sprint Planning

Drag-and-drop issues between sprints. See how full each sprint is. Sort, filter, reorder — all without leaving the app.

🔗

Dependency Tracking

Cross-sprint blocker detection, dependency map, and violation highlighting. Know which blockers will cascade before they do.

🚨

Alerts

Overdue items, missing estimates, dependency conflicts, circular dependencies — six categories of issues that need attention, surfaced automatically.

🎯

Epic Tracking

Progress bars, delivery forecasts, and scope growth per epic. Cross-epic dependency analysis shows which epics are blocking each other.

📈

Velocity History

Sprint-over-sprint performance trends. See how fast your team actually delivers vs how much you plan — then use that data to plan better.

📅

Plan Review

Same risk analysis for teams that don't use sprints. Groups work into weekly buckets by due date with What-If and Monte Carlo forecasting.

See All Features with Screenshots

We're Looking for Beta Testers

Project Commander is in active development and we're looking for teams to try it and share feedback. Free access during the beta — no commitment, no credit card.

Join the beta? Questions or feedback? support@projectcommander.app