 Project Commander Docs
← Back to site
Project Commander Docs
← Back to site
Epics Tab — Feature Guide
What it's for
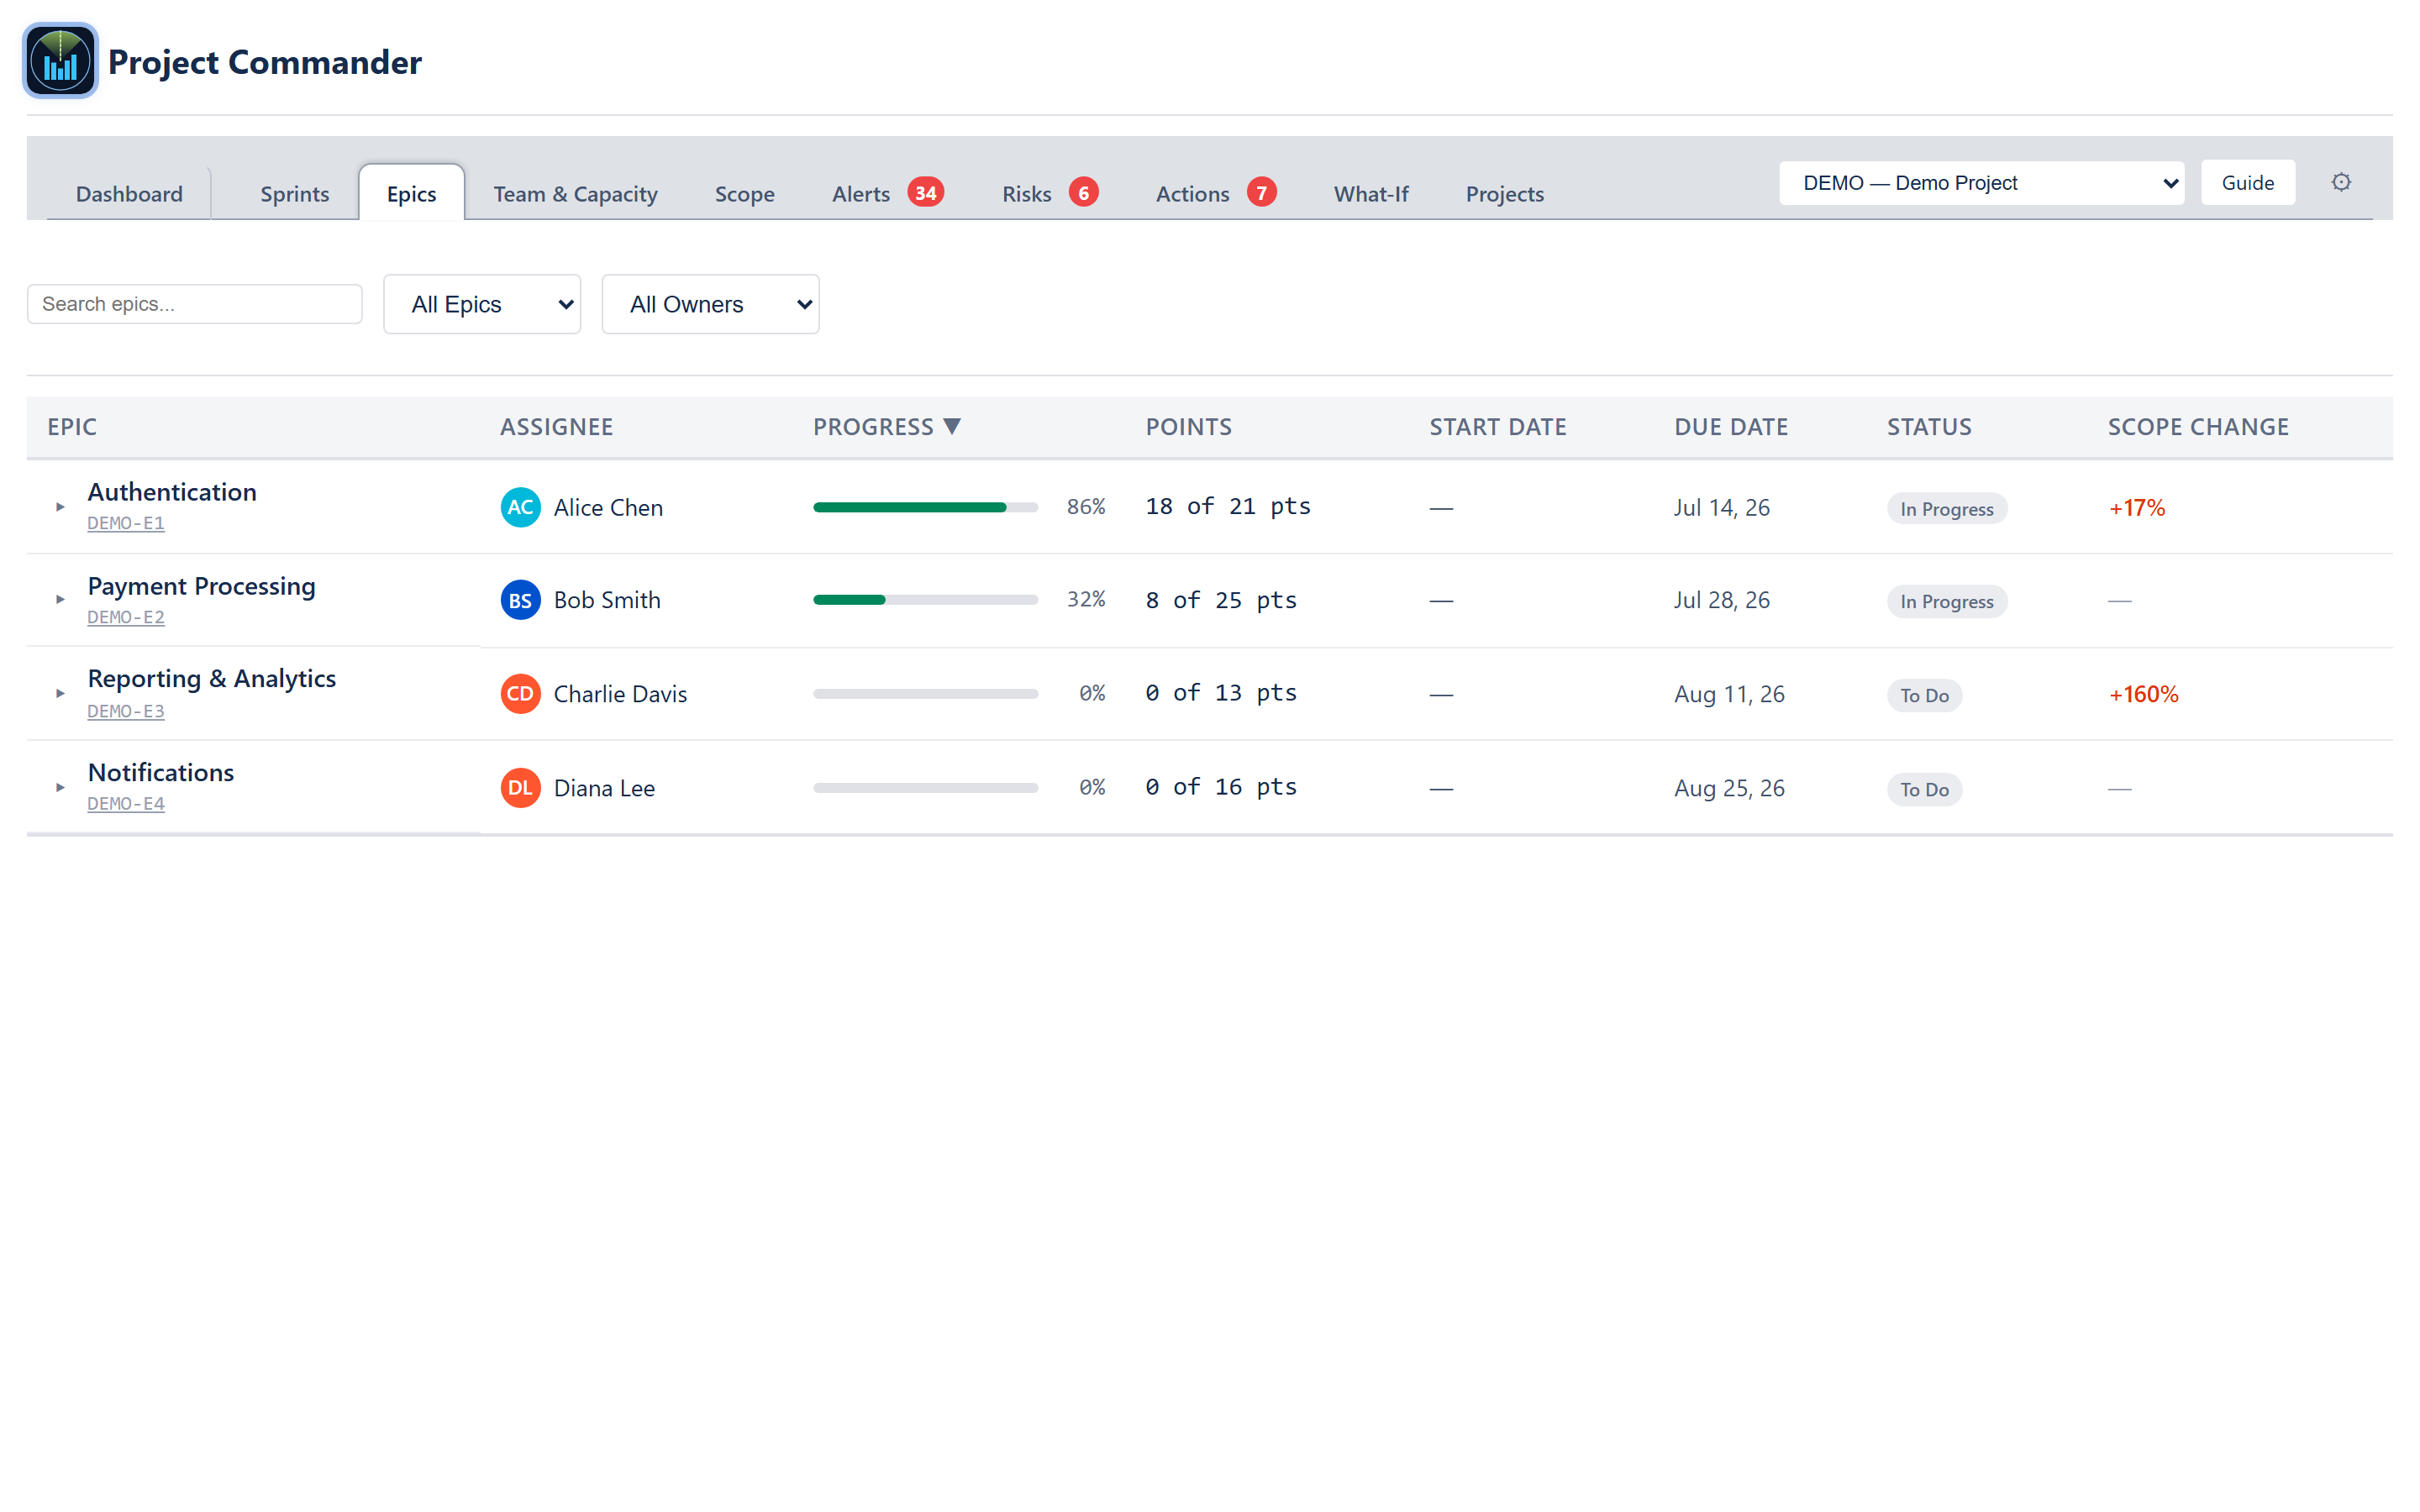
The Epics tab shows the project's hierarchical scope — every epic plus its child issues — and rolls up progress, scope-change, and status per epic. Where the Sprints tab is organised around time (which iteration owns which work) and the Scope tab around change over time, the Epics tab is organised around grouping (what work belongs together) and completion against that grouping.
It answers four questions: what are we building right now; how far through each epic are we; which epics are growing in scope versus shrinking; and which epics are at risk of missing their target. It is intended for product, programme, and delivery leads who want to assess the project at the work-package level without opening Jira.
The tab requires that issues are linked to a parent epic in Jira. Issues without an epic parent are excluded.
Toolbar
A single row at the top with the search input, the status filter, and the assignee filter. All three filters compose — an epic must match all of them to appear.
Search field
A text input that filters the epic list as the user types. Matching is case-insensitive and runs against the epic's summary and Jira key. Empty input shows everything.
Status filter
A dropdown labelled All Epics. The options are All Epics plus every computed status band present in the current set of epics — Done, On Track, At Risk, Behind, Overdue, To Do (see Status pill below for how each band is derived).
Owner filter
A dropdown labelled All Owners. Lists every assignee found across the visible epics; selecting one narrows the list to that person's epics only.
Section header
Collapse All button
Appears only when at least one epic is currently expanded. Clicking it closes every open epic in one click. There is no symmetric Expand All button — expanding is one-at-a-time by clicking individual rows.
Epic row (always visible)
The Epics tab is presented as a flat list of epic rows, each clickable to expand a child-issue table beneath it.
Epic row columns
- Caret — a right-pointing chevron when the epic is collapsed, down-pointing when expanded.
- Epic — the issue summary in regular weight; the Jira key beneath it as a small link. Clicking the key opens the issue in Jira in a new tab.
- Assignee — an avatar chip with the assignee's initials (e.g. AC, BS) in a colour derived from their name, plus the assignee's name. Unassigned epics show —.
- Progress — a horizontal bar (6px tall) plus a percentage label. The bar fills from left to right and is coloured by progress band: green ≥ 60%, amber 30–59%, red < 30%. The percentage is capped at 99% when the points add up to complete but not every child issue is in a done status (so the row never reads 100% while a child issue is still open).
- Points / Hours — X of Y pts (or of Y hrs). The unit and the calculation depend on the project's estimation mode (see below).
- Start Date — the epic's created date, shown as Apr 12, 25 (the short month/day with a 2-digit year always included).
- Due Date — the epic's due date. Same formatting as Start Date. — when missing.
- Status — a coloured pill showing the epic's computed health band (see Status pill below).
- Scope Change — a signed percentage change versus a baseline date (see Scope change below). Red for growth, green for shrink, grey — when no baseline can be established or the epic is done.
Hover and done styling
Hovering a row tints the background (#FAFBFC). Epics in Done status render at 60% opacity so the open epics stand out.
Sorting
Every column header is clickable. Clicking toggles between ascending and descending; the active column shows a ▲ or ▼ next to its label. Clicking a different column starts that column descending. Sorts are stable, so a tied secondary order is preserved between sorts.
Child-issues table (expanded view)
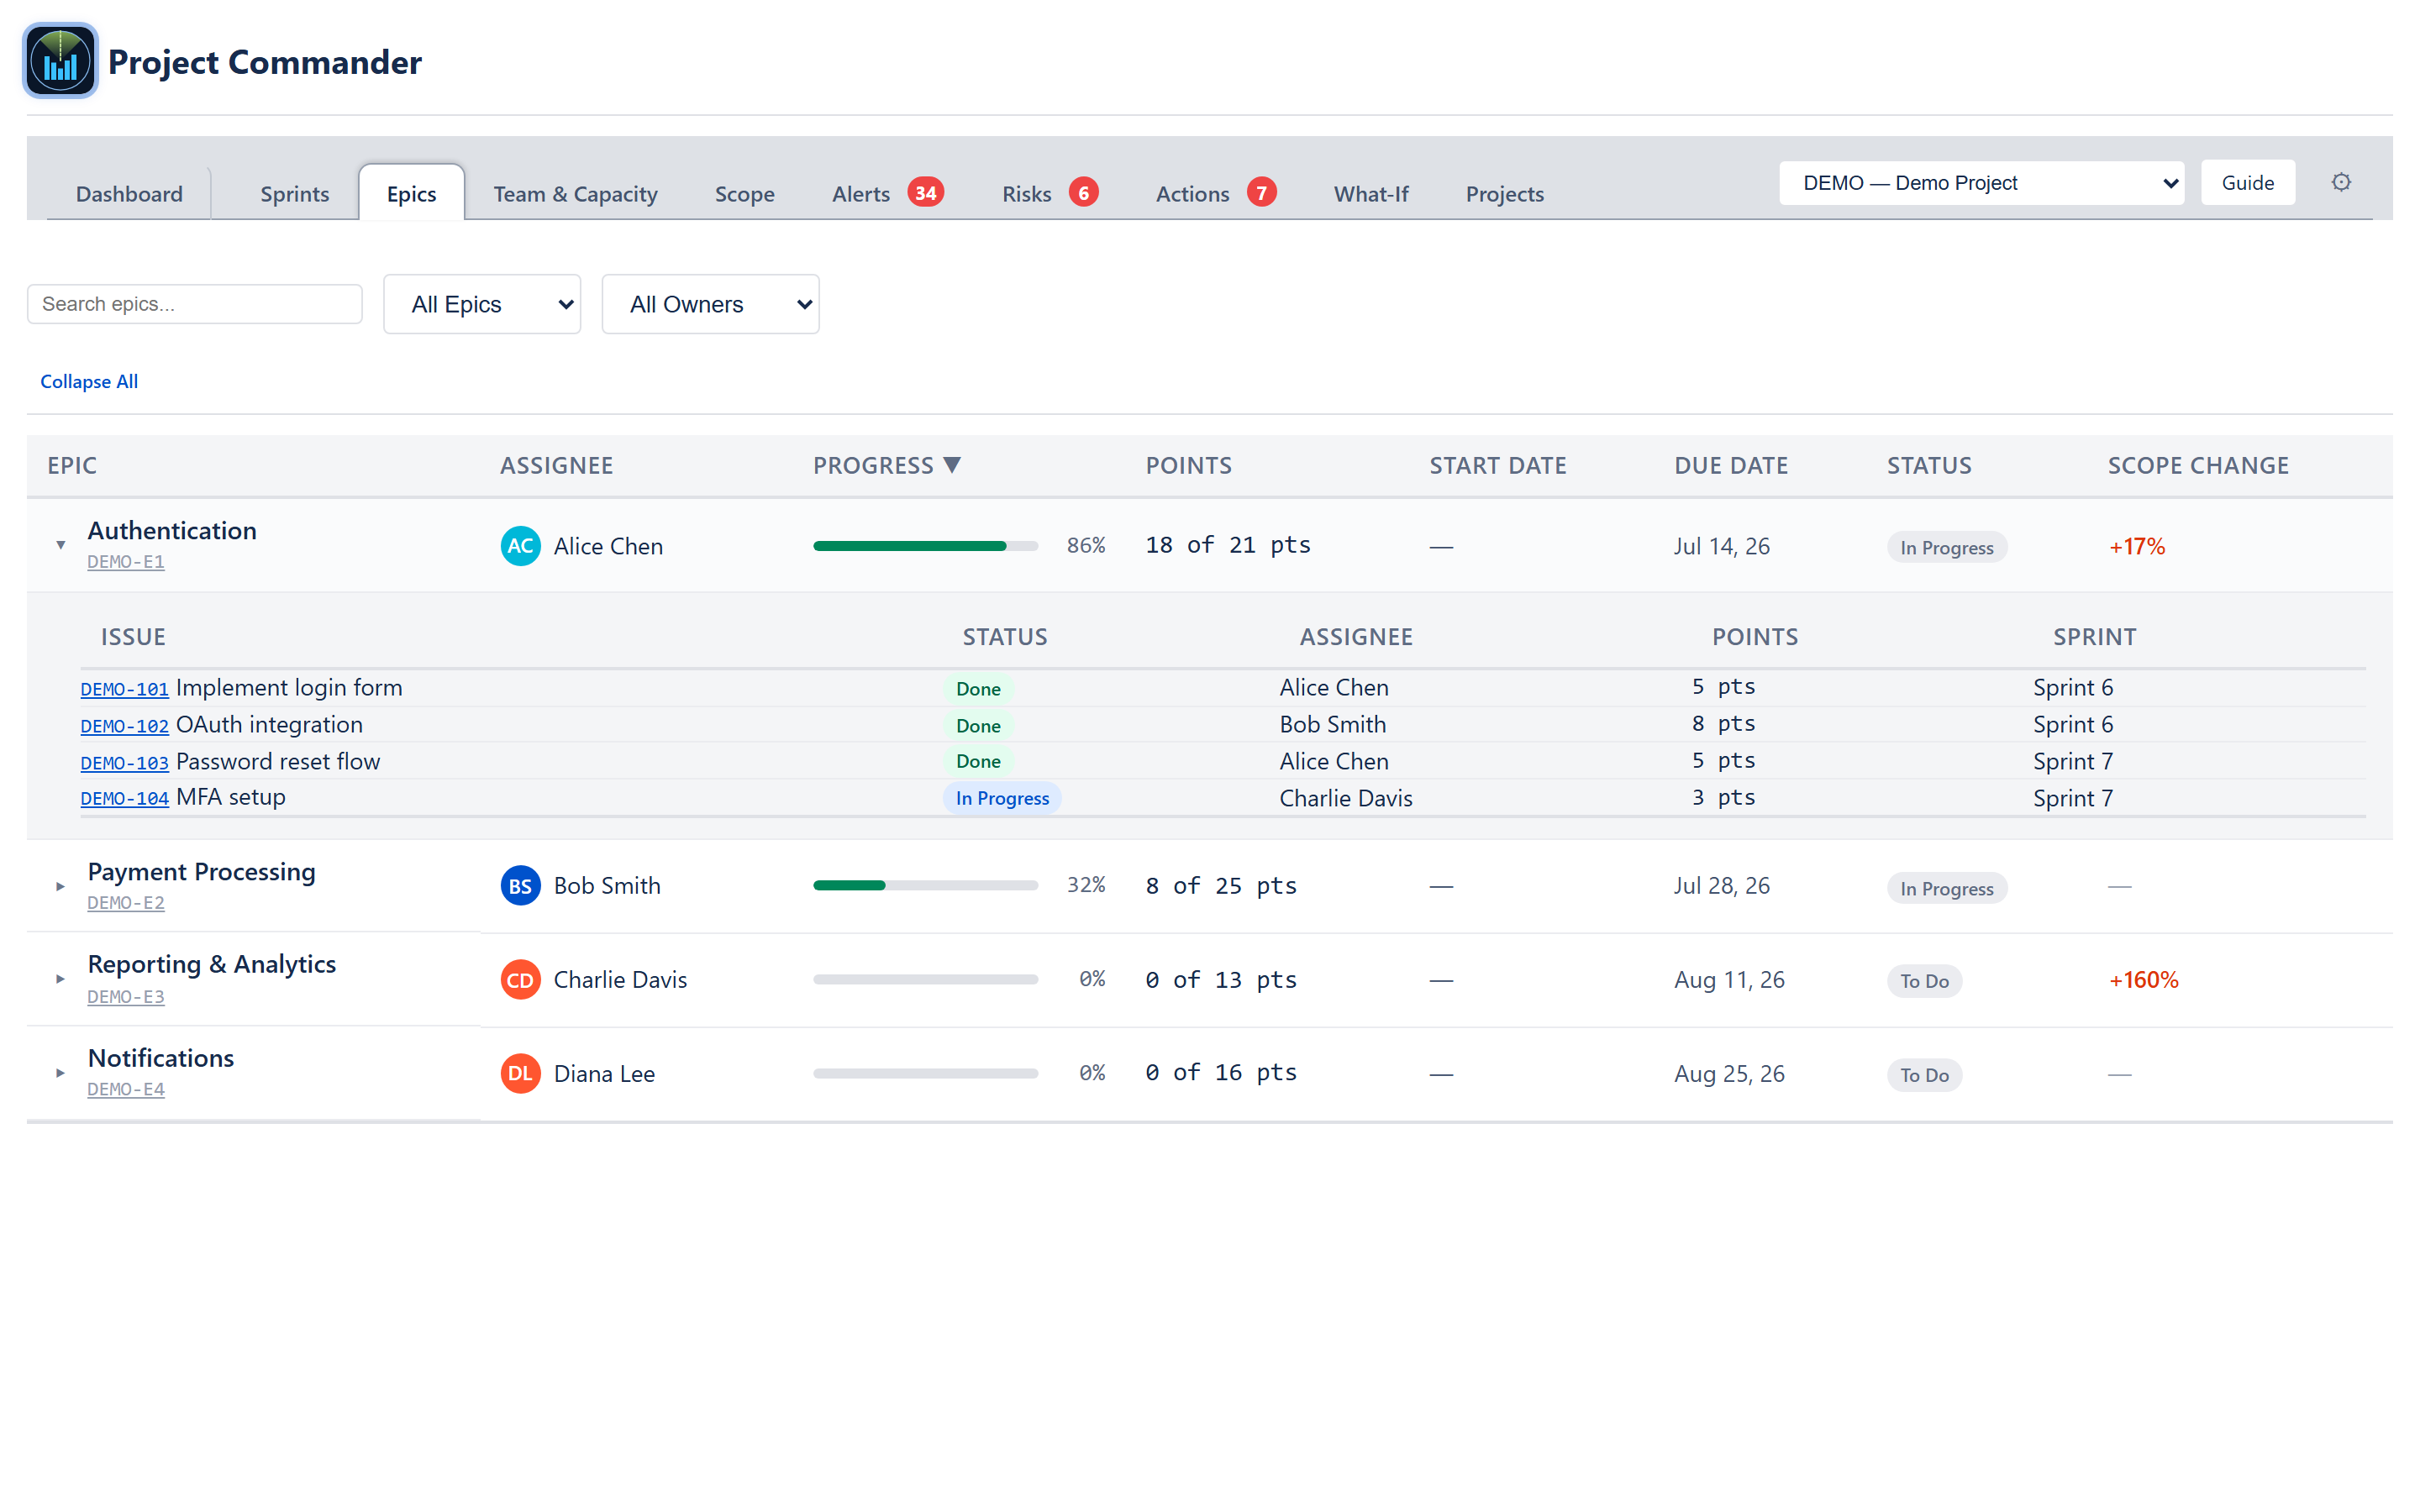
Clicking an epic row toggles a child table below it. Only one epic's children are open at a time — clicking a different epic's row collapses any other open epic.
Child table columns
- Issue — Jira key (monospace blue link) plus issue summary.
- Status — a small pill showing the child's raw Jira status: green for done statuses, blue for In Progress, grey for everything else.
- Assignee — plain text only (no avatar in the child table); — when unassigned.
- Points / Hours —
X ptsorX hrsper single issue. - Sprint (sprint mode only) — the sprint name the issue currently lives in, or Backlog for unscheduled work.
Child table styling
Inset background #F4F5F7, 12px font, 32px left padding, no further nesting (subtasks under a story are not shown).
Status pill
The pill in the Status column shows a computed health band, derived from the epic's progress, children, and due date: Done (100% complete, or the epic's own Jira status is a done status), Overdue (past its due date and not done), To Do (no children, or 0% with nothing in progress), Behind (progress below 30%), At Risk (30–59%), On Track (60% or more). Colours: Done and On Track green, At Risk amber, Behind and Overdue red, To Do grey. (The child-issue table below shows each child's raw Jira status instead — green for done statuses, blue for In Progress, grey otherwise.) The status-filter dropdown in the toolbar lists the computed bands present on the current epics.
(The progress bar's colour is a separate thing — it is banded by completion, green ≥ 60% / amber 30–59% / red < 30%, as described in the Progress column above. That bar colour is per-epic completion only; it does not set the status pill.)
Scope change
A baseline date is the earliest active or future sprint start in the project. Issues created after that date count as added scope. The percentage is (currentPts − originalPts) / originalPts × 100.
When the backend exposes a richer per-epic scope endpoint, that data is preferred; otherwise the client-side fallback runs over the issue list. The percentage is — (grey) when the epic is Done or when no baseline can be established (for example, no active or future sprints exist).
Empty / loading / error states
- Loading — while the JQL fetch is in flight and no cached issues are available, a centred Loading epic data… with a spinner.
- Error — if the fetch fails before any cached data exists, a red message Failed to load issues: <error>.
- No epics found — once the fetch completes but no issues with epic parents exist, the panel shows a large icon (📋), a No Epics Found heading, and a hint to ensure issues have epic parents in Jira.
Points vs. Hours mode
The whole panel respects the project's estimation mode.
- Points mode (default) — the column header reads Points, child rows read N pts, totals are integer or one-decimal points.
- Hours mode — header reads Hours, rows read N hrs. Calculations prefer Jira's remaining, original, and logged-time estimates (converted from seconds to hours) over story points; when none of those are present the app converts story points using a configurable hours-per-point factor (default 4) so totals still render.
In hours mode, done per issue is the time spent; total is the first available of original estimate, then remaining + spent, then points-as-hours (a fallback chain, not a maximum). Done equals total on issues marked done so the epic completion percentage matches the points-mode result.
Roll-up logic
The epic's Done and Total values are pure sums over its children, with the same point-or-hour rule applied to each child. Subtasks roll up into their parent story automatically through Jira's hierarchy — they do not appear as their own row in the child table.
Numbers are rounded to one decimal place to keep the column tidy.
Cross-cutting modes and settings
- Estimation mode (points / hours / days) — drives the column header, the unit suffix, and the formulas. Days mode converts points to days using the same hours-per-point factor, divided by an 8-hour day.
- Sprint mode on/off — toggles the Sprint column inside the child table. When sprints are off the column disappears.
- Programs (multi-project) view — when more than one project is active, the panel still renders one flat list; the parent app filters it to the currently-selected project.
How the numbers are computed
- Progress per epic — done points ÷ total points × 100, with the 100% → 99% cap applied when not every child issue is in a done status.
- Scope change — see ALGORITHMS Appendix → Scope Trajectory (rules) and the description above.
- Status pill — the epic's computed health band (see Status pill above); ALGORITHMS Appendix → Sorting and Visual Rules covers the band colours.
- Progress percentage, Scope Change percentage, and the status band are the computed values rendered on this tab. The Epics tab does not render a per-epic velocity or forecast figure.
Effects on other parts of the app
- The Scope tab uses the same baseline definition for its scope reconstruction; a scope-change percentage shown here will match the Scope tab's per-bucket Added/Burned column.
- Sprint mode controls the visibility of the Sprint column here and the entire Sprints tab.
- Estimation mode is global; switching it from Settings changes the unit on every Epics row immediately.
- The status pill and the per-issue hover key are clickable; clicking opens the same in-app issue panel used by Sprints, Alerts, Risks, and Actions.