 Project Commander Docs
← Back to site
Project Commander Docs
← Back to site
Sprints Tab — Feature Guide
What it’s for
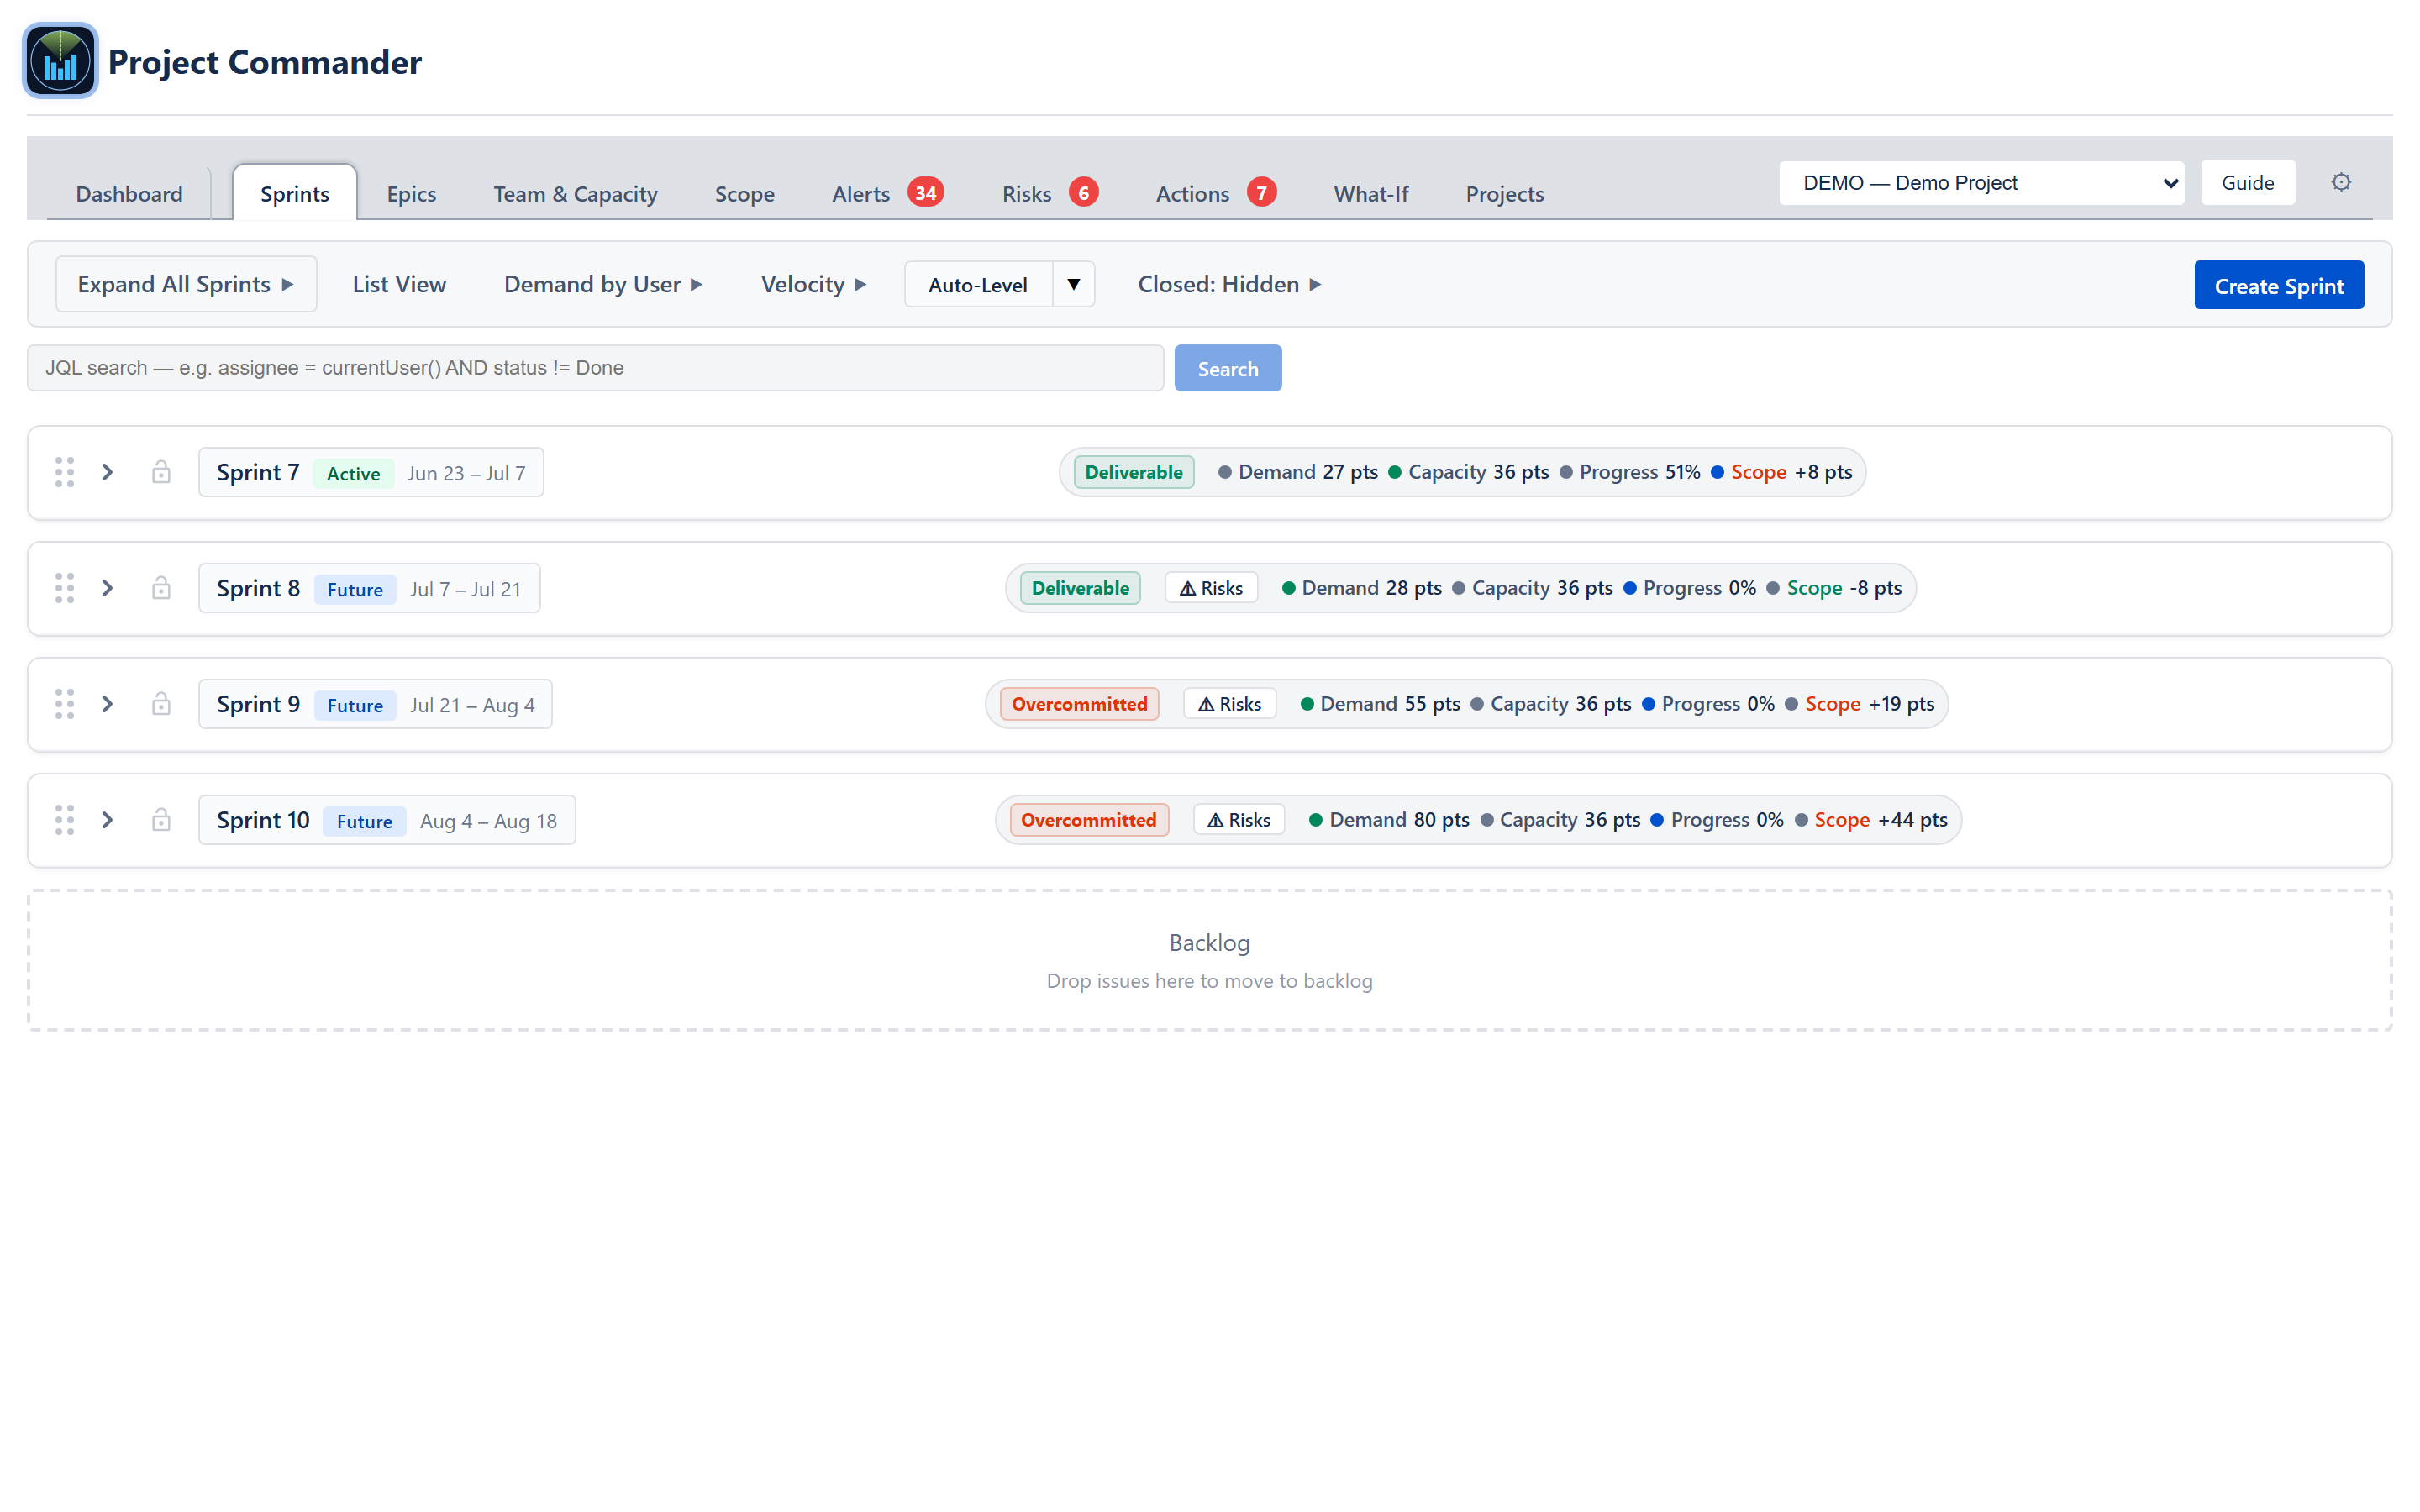
The Sprints tab is the single execution view for a project’s sprint cadence. It combines sprint planning, retrospectives, status, and risk analysis into one stack of expandable sprint rows plus a backlog row. From here a planner can:
- See commitment versus capacity for every active and future sprint at a glance.
- Drag work between sprints and into or out of the backlog.
- Lock issues or whole sprints in place.
- Run automated rebalancing across sprints.
- Start, complete, and delete sprints, including roll-over of unfinished work.
- Switch any row between a forward-looking Sprint view and a Status or Retro view.
The tab is strictly per-project. In “All projects” mode it is replaced with a notice asking the user to pick a single project, because sprint cadences from different projects cannot be summed.
Toolbar

A single row at the top of the tab. Left to right:
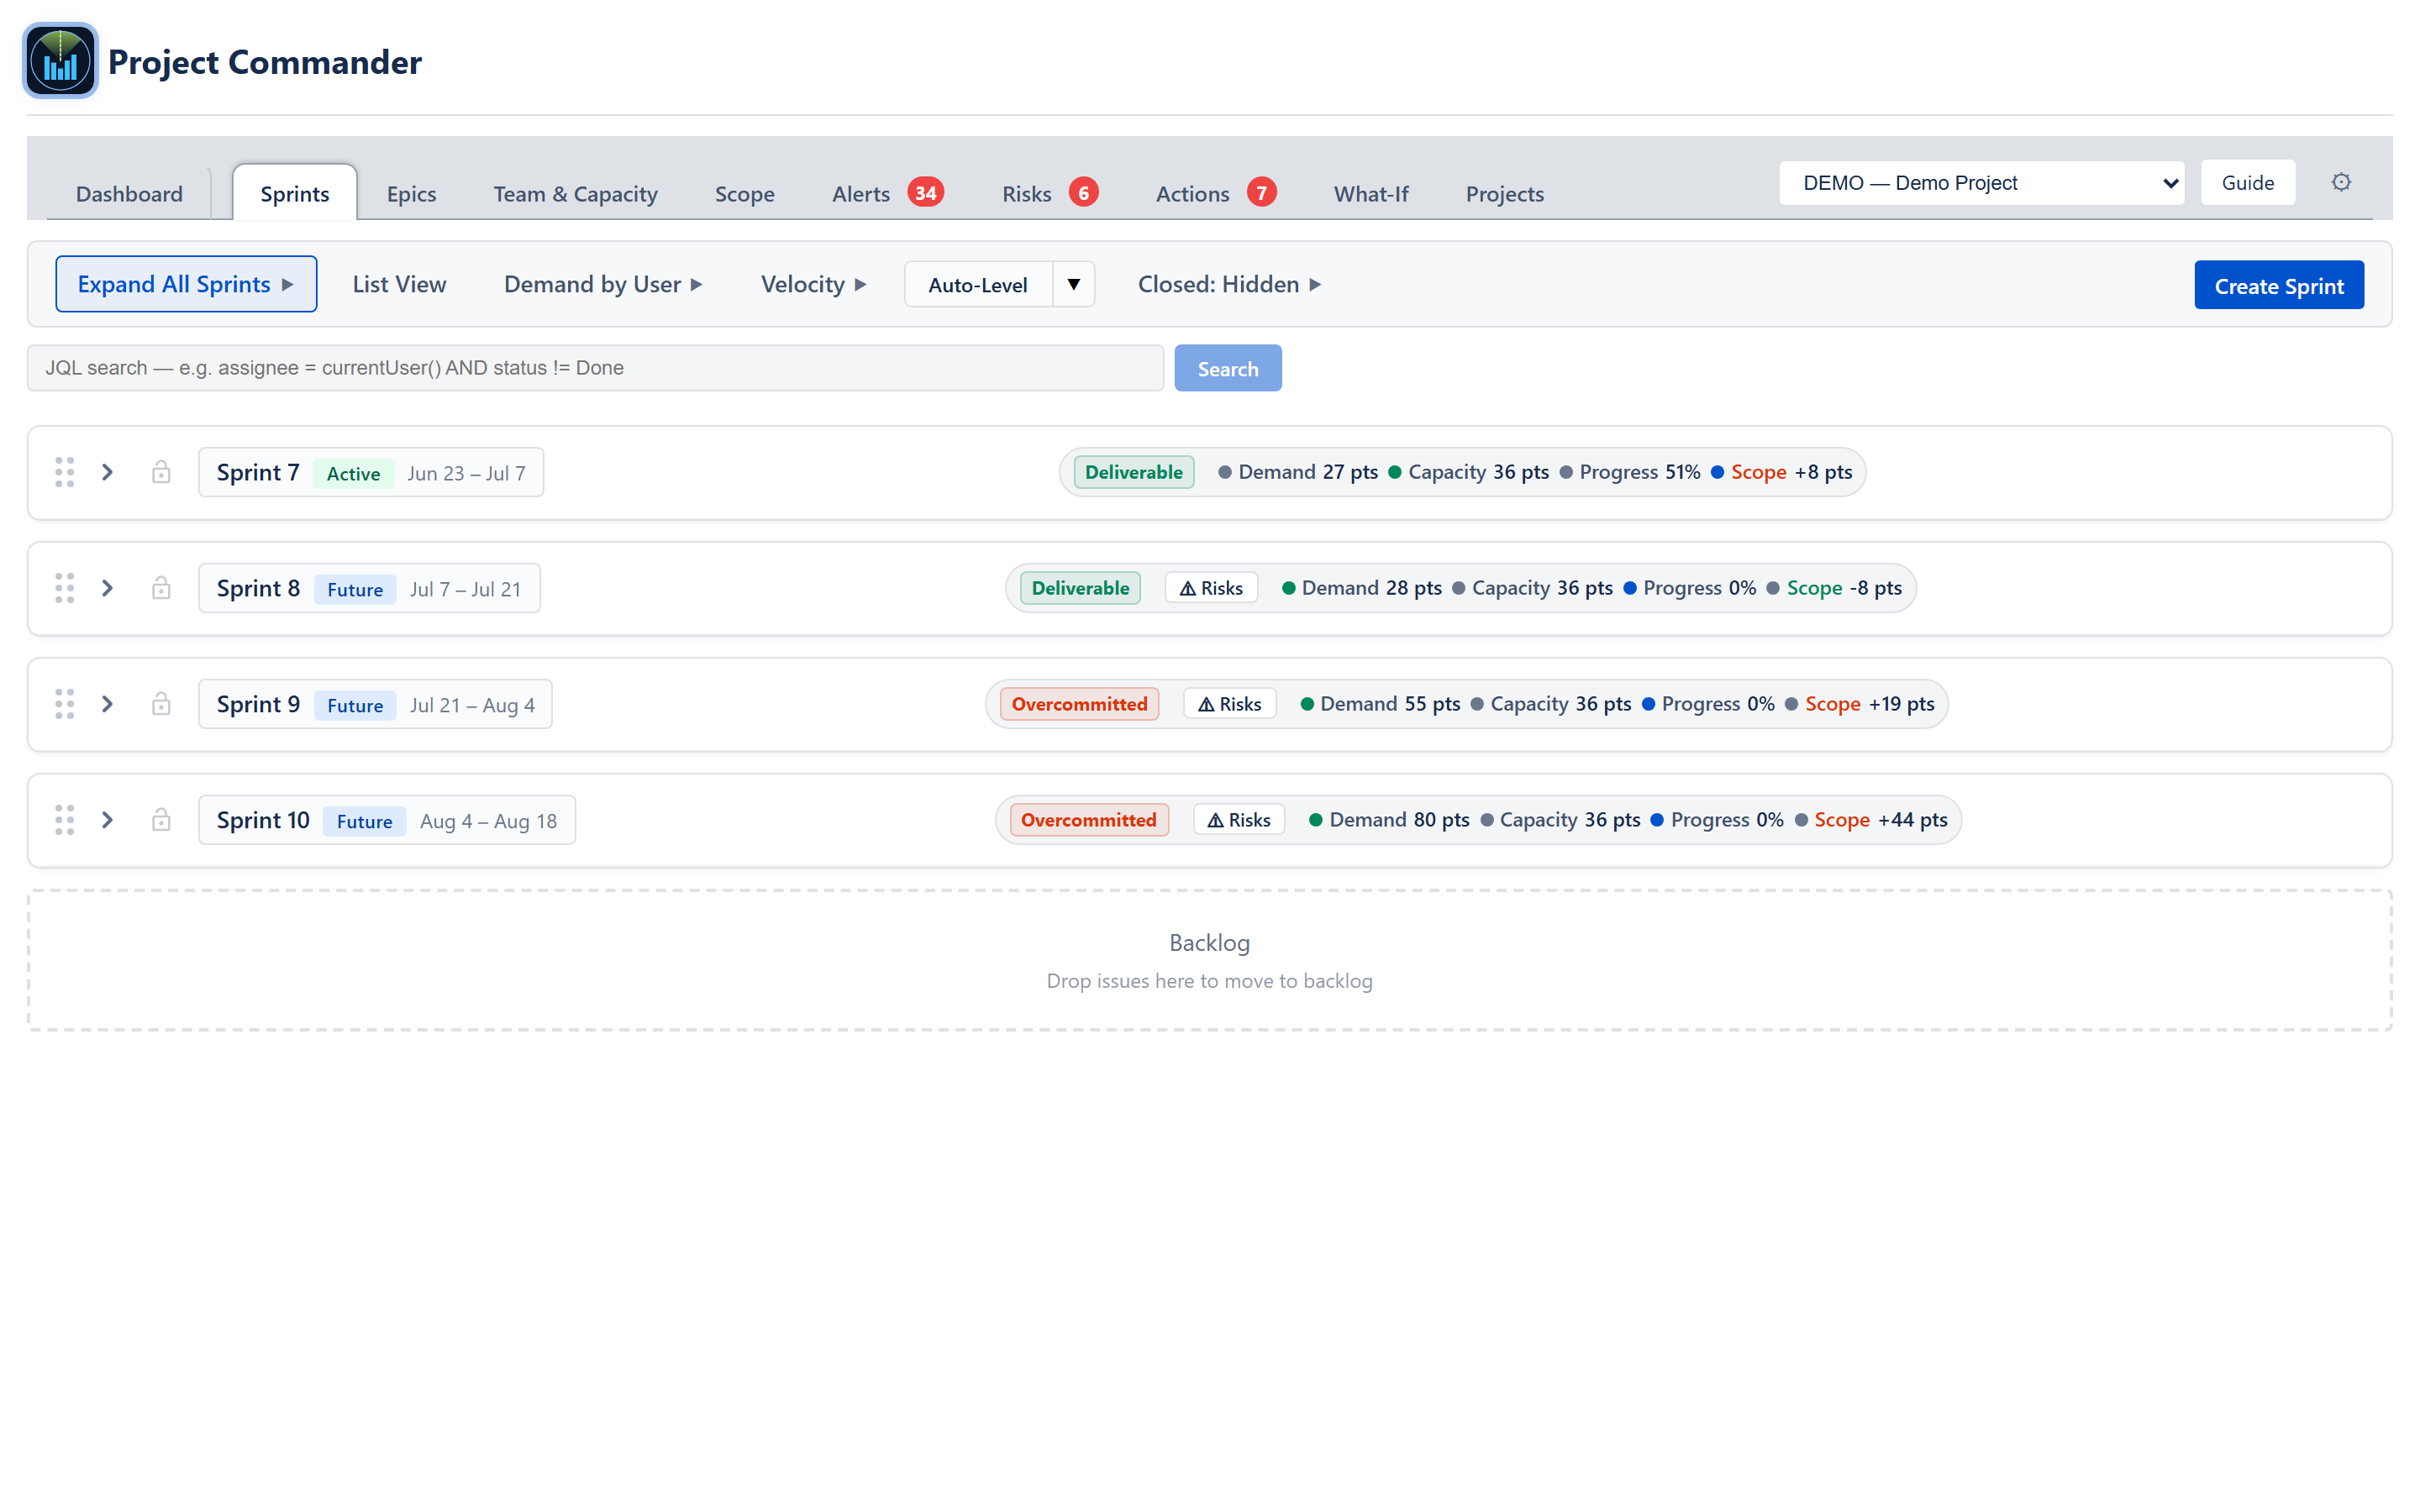
Collapse All / Expand All Sprints
Toggles every sprint row plus the backlog open or closed at once. The label flips to “Expand All Sprints” when everything is already collapsed.
List View / Sprint View
List View replaces the per-sprint cards with a single searchable, sortable table of every issue across every sprint plus the backlog. Search filters across key, summary, assignee, sprint name, and status. Click any column heading to sort ascending; click again for descending. Visible columns follow the project’s configured columns.
Demand by User
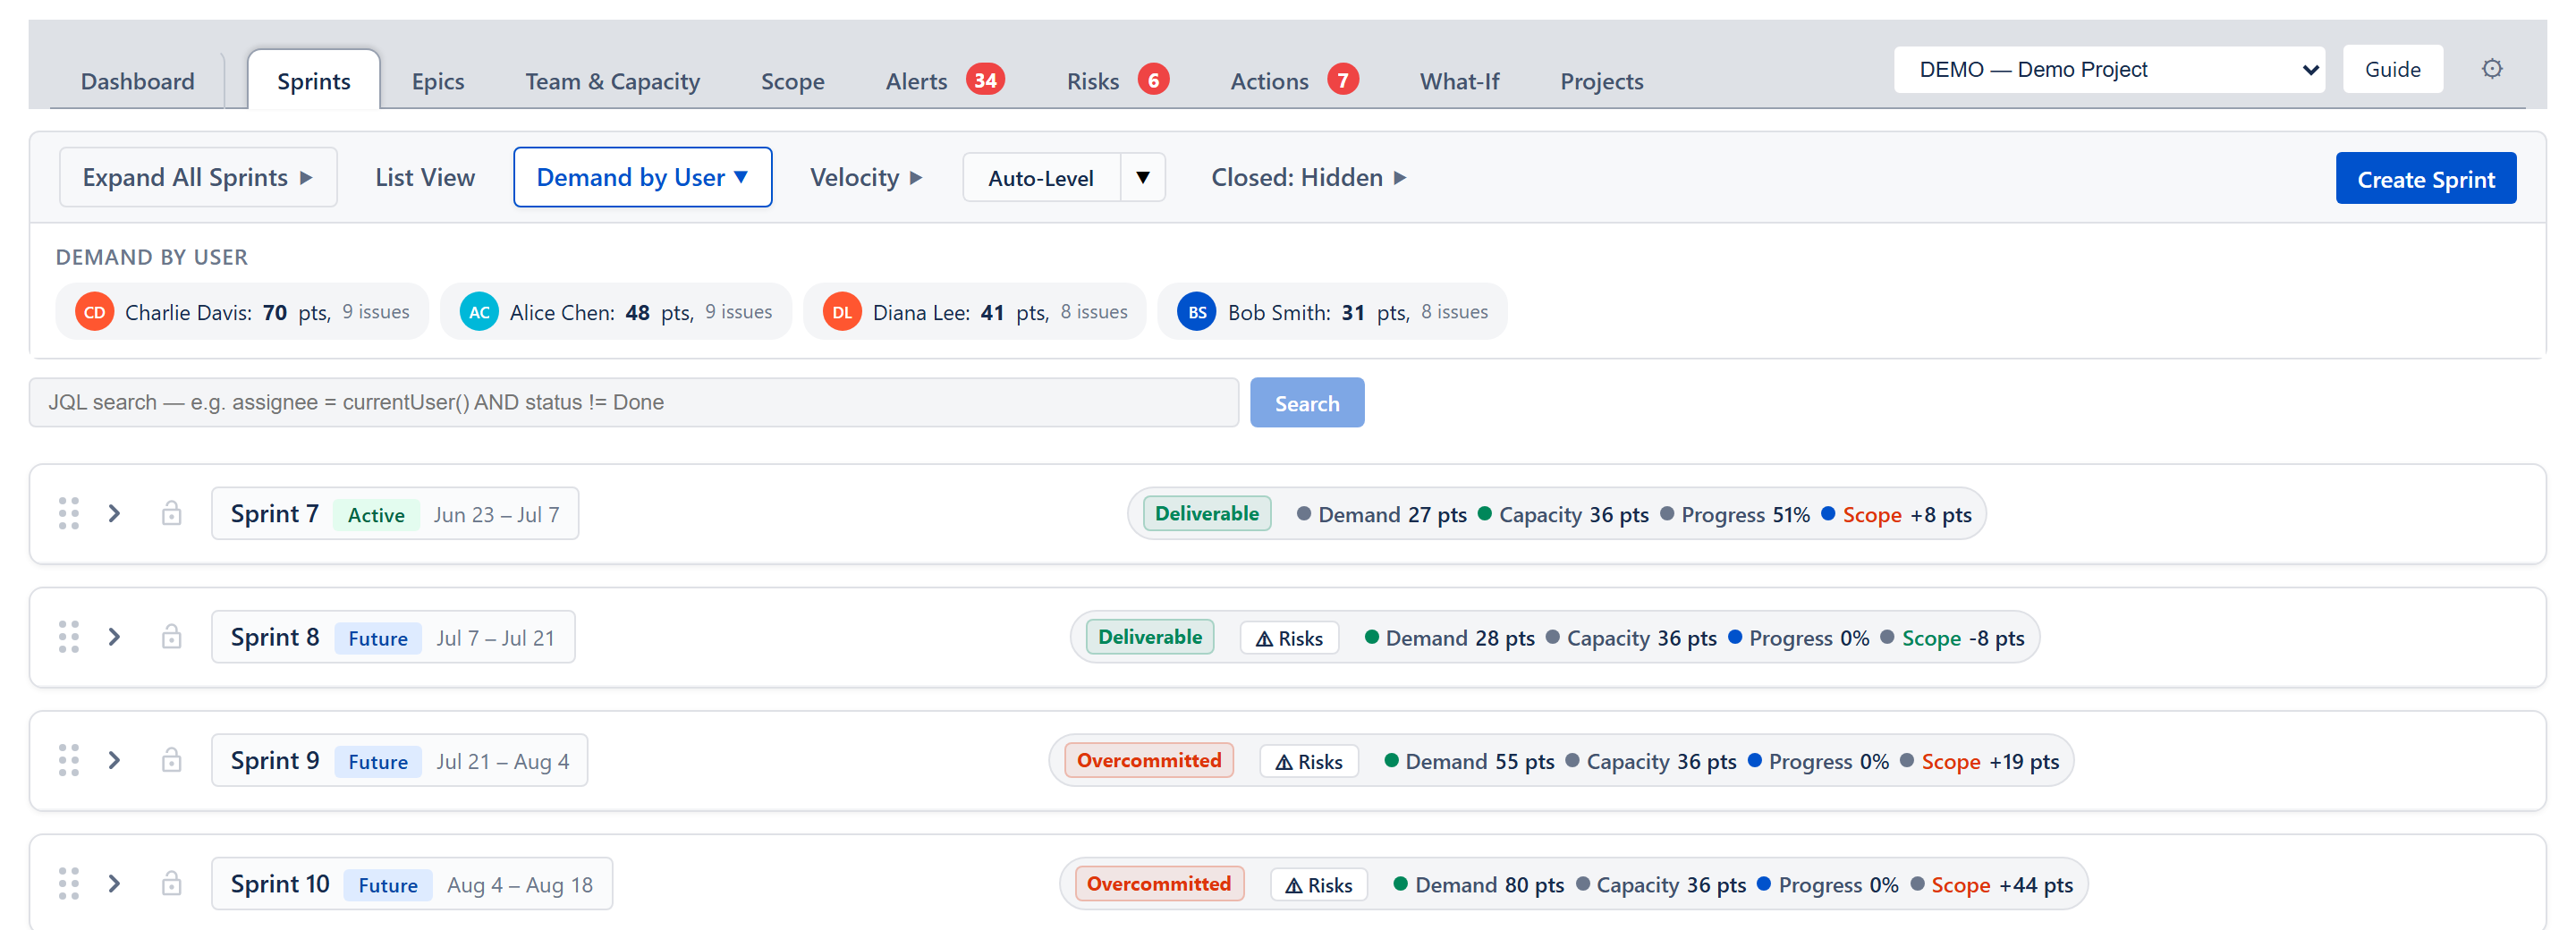
Appears when at least one issue has an assignee. Opens a panel of clickable user chips showing the user’s name, total demand, and issue count. Clicking a chip filters the rest of the application to that user. Clicking the same chip again clears the filter.
Velocity
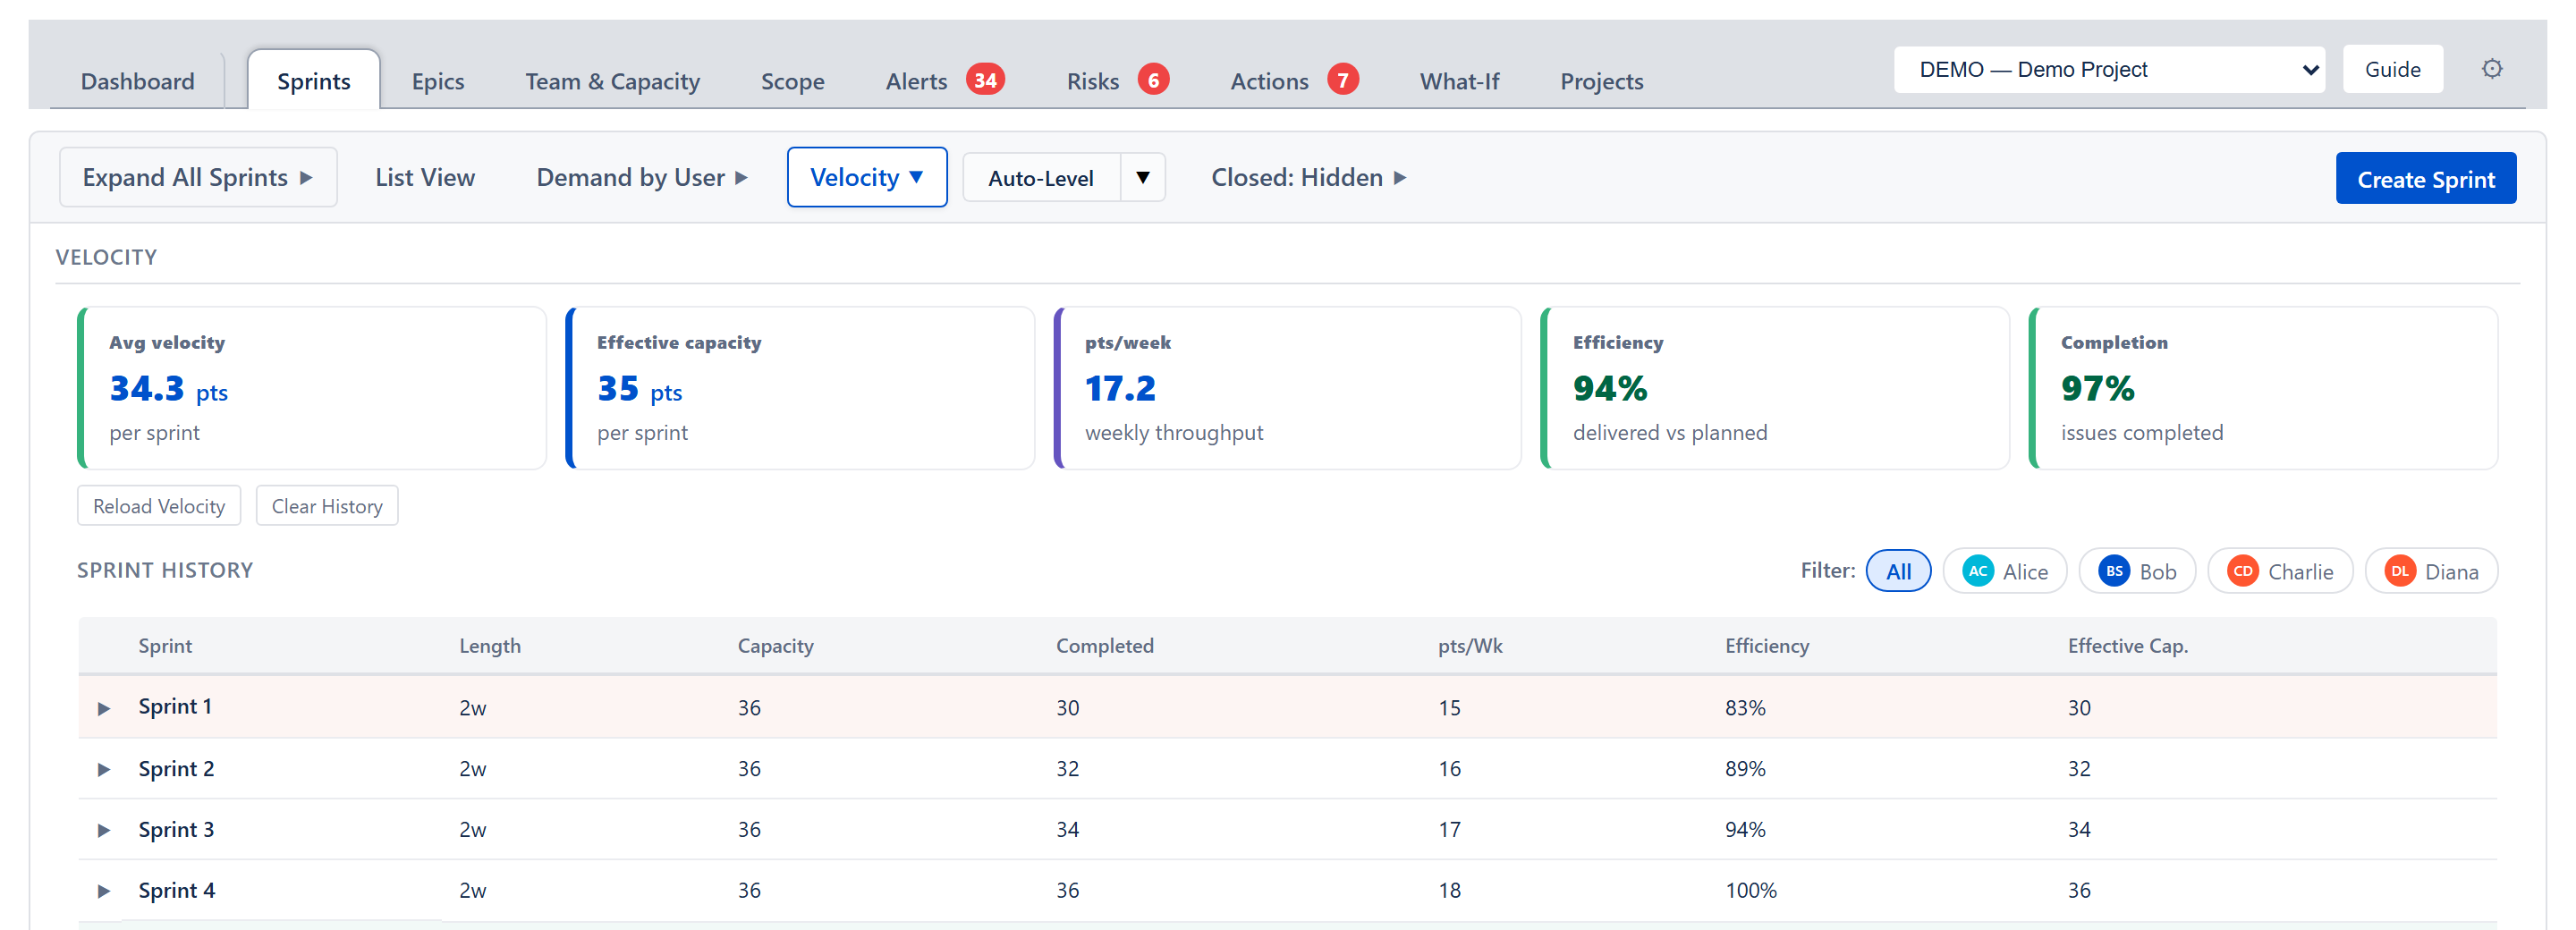
Opens an inline panel containing:
- Five summary cards: average velocity, effective capacity, points per week, efficiency, and completion percentage. The effective-capacity card normally reads sprint capacity × measured efficiency; when no efficiency has been measured it falls back to average-per-week × sprint length and says so on the card ("avg/week × weeks — no measured efficiency").
- A sprint-history table for closed sprints with length, capacity, completed, points per week, efficiency, and effective capacity. Each row expands to a per-issue table (status, key, summary, assignee, points, and flags) for that sprint; per-member figures come from the filter chips, not the row expansion.
- Filter chips to view metrics for the whole team or one team member.
- Reload Velocity (refetches the latest history from Jira) and Clear History buttons.
- A Lookback dropdown — Last 3, 5, 8, or 10 sprints — that is shared across every tab.
- An Import from Completed Sprints action that appears only in the empty state (when there is no velocity data yet) for bringing in historical velocity data. The outcome is shown next to the button after the click — a green "Imported N sprint(s)" on success, or a red "Import failed: …" with the reason.
Auto-Level (split button)
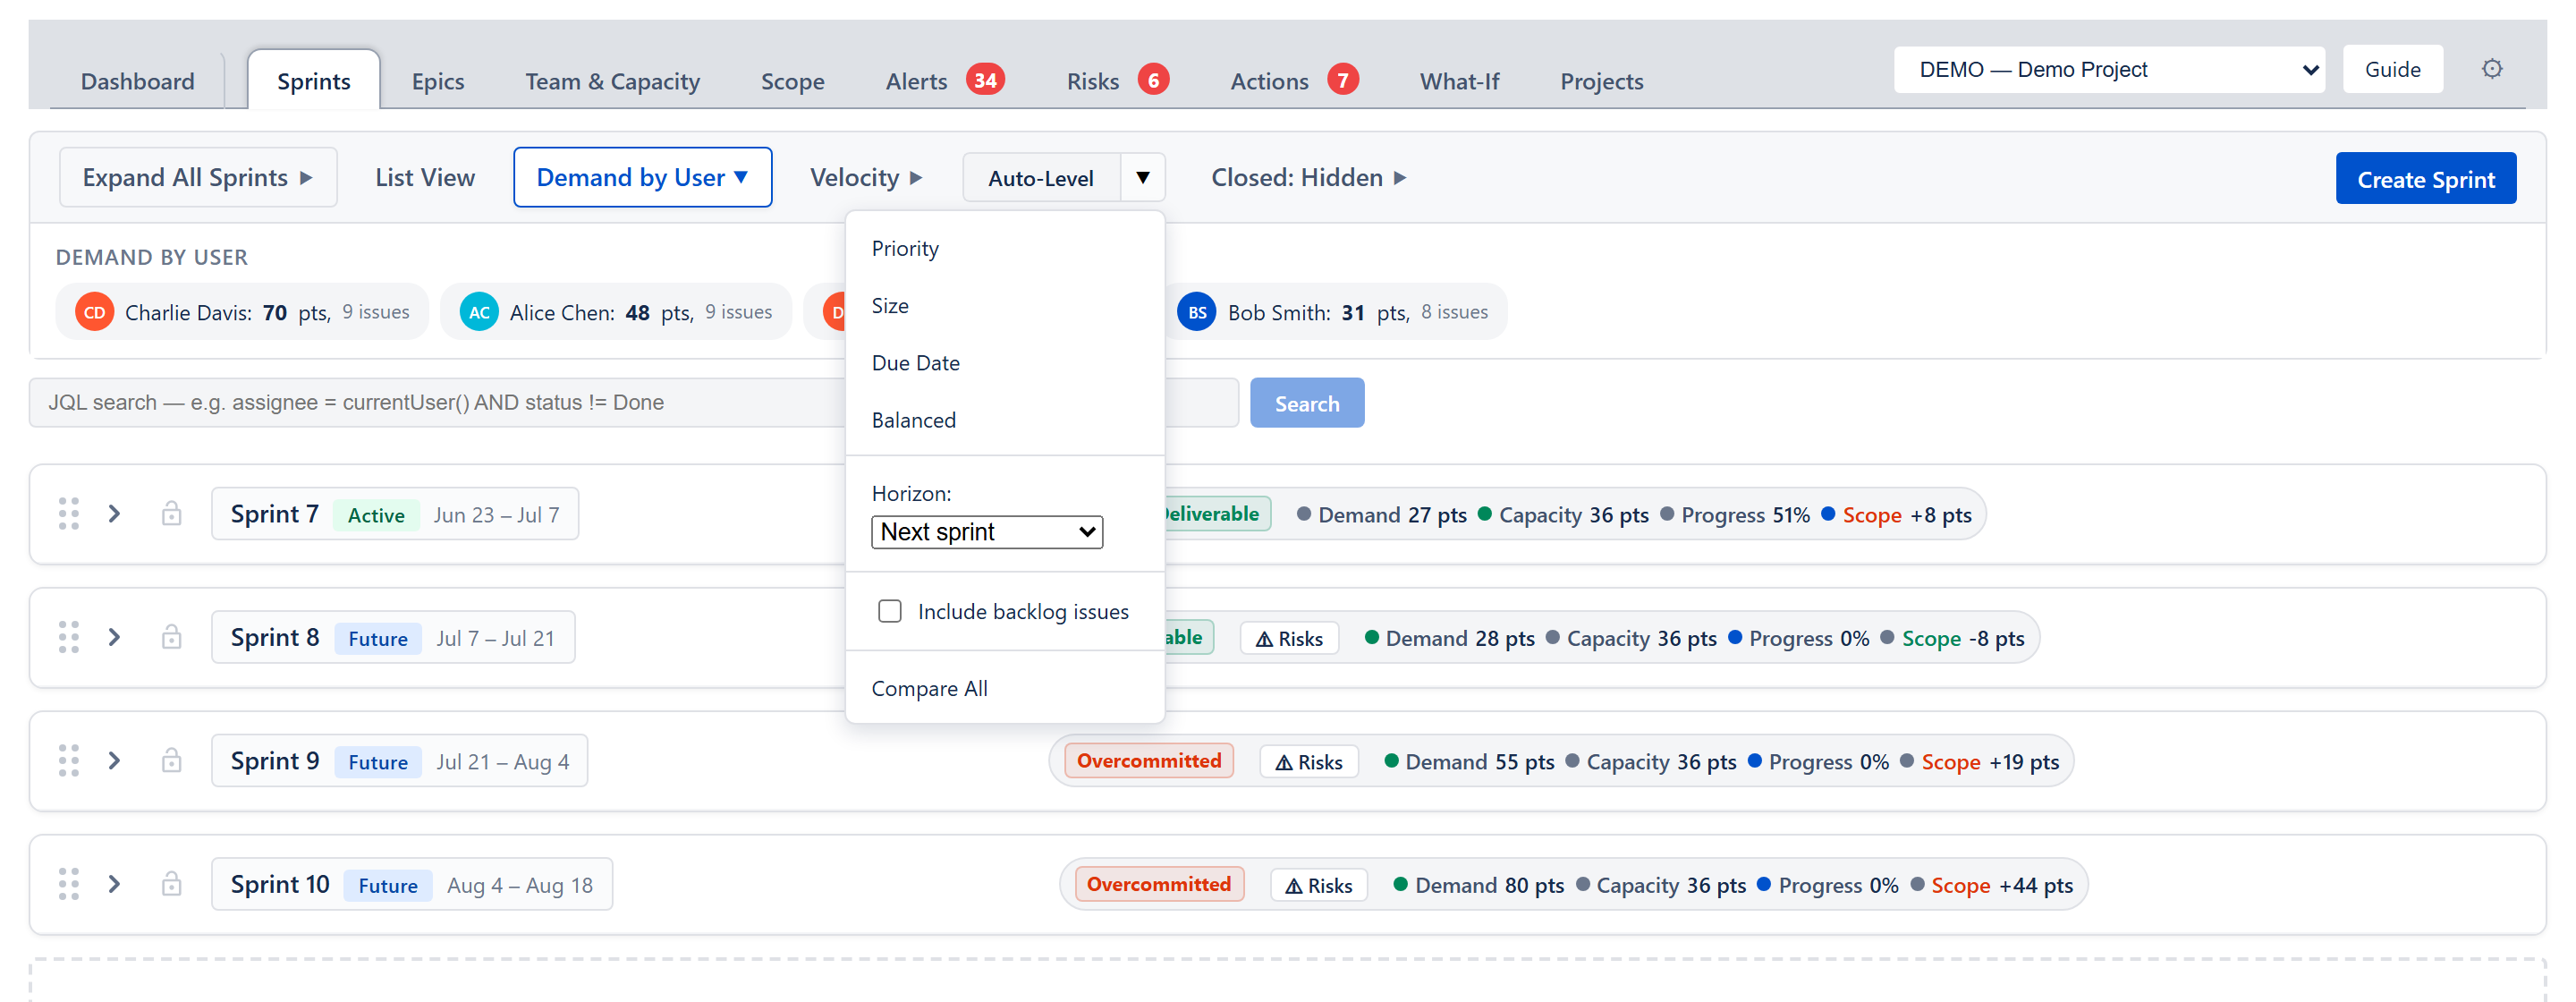
Main button starts the rebalance; the chevron opens a strategy menu:
- Priority — fills sprints front to back with highest-priority issues first.
- Size — fills sprints front to back with smallest issues first.
- Due Date — fills sprints front to back with soonest-due issues first.
- Balanced — places the largest issues first into the sprint where they fit best, balancing remaining room and workload.
The same menu also offers:
- Horizon — a dropdown limiting how far ahead Auto-Level rearranges: Next sprint, Next 2 sprints, Next 3 sprints, or All sprints.
- Include backlog issues — a checkbox that controls whether the backlog is in scope for Auto-Level and other views.
- Compare All — runs all four strategies in parallel and shows a side-by-side delivery forecast so the planner can pick the best plan.
Selecting a strategy immediately runs a dry-run preview without touching Jira. Selecting a different strategy mid-session swaps the preview to the new arrangement.
Closed sprints chip
A dropdown with four explicit modes for showing historical sprints:
- Hidden — no closed sprints (the default; fastest).
- Last 5 — the five most-recent closed sprints, sorted by end date.
- Last 20 — the twenty most-recent closed sprints.
- All — every closed sprint available.
Closed sprints render inline, interleaved chronologically with active and future sprints by start date (a closed sprint that ran in February sits above an active sprint that started in March, which sits above an April future sprint). The chip just caps how many of the most-recent closed sprints are loaded; their position in the list comes from their dates.
Create Sprint
A primary button on the right. Hidden in read-only mode. Opens a dialog that creates a new sprint on the configured board with a chosen name, start date, end date, and goal.
Auto-Level session
When Auto-Level is active, the toolbar expands with a session panel:
- Moved issues are flagged inline rather than via a legend: each moved row carries an Auto-levelled or Manually moved badge, and locked issues show a lock icon — so the planner can tell why each issue ended up where it did. (There is also a Deviations summary line noting whether the strategy could place every issue as preferred, or counts of what was constrained by capacity, dependencies, due dates, locks, or the horizon.)
- Balance Preview — lists the first twenty proposed moves (issue, summary, from sprint → to sprint, points), with overflow shown as “…and N more”. Apply commits the moves; Cancel exits.
- No-capacity warning if there is no team capacity, no velocity history, and no per-user capacity, so the planner knows the fallback is the global point limit.
- Forecast pill — projected on-time percentage with P50 and P85 sprint estimates, coloured green, amber, or red.
- Skill mismatch panel — when team skills are configured, surfaces per-sprint counts of issues whose assignee lacks required skills. Hover lists the issues and missing skills.
- AI Review — when an AI key is configured, asks the AI to review the staged plan for dependency issues, overloaded developers, and capacity concerns. Returns a one-sentence summary, per-sprint findings, and recommendations.
- Action buttons — Undo Changes (reverts to the original arrangement, stays in session), Accept (commits to Jira), AI Review, and Exit (cancels the session entirely).
- Delivery Forecast comparison — appears when Compare All is on, showing all four strategies side by side.
- Oversized Placement dialog — appears at Accept time when one or more issues are larger than every sprint’s capacity. Each oversized issue gets its own destination dropdown (Backlog is recommended, but any open sprint can be picked).
During a session, drag-drops between rows are local previews only — they do not write to Jira until the planner clicks Accept. Moved issues are tagged with a small badge showing where they came from and are sorted to the top of each sprint so they are easy to spot.
Sprint row
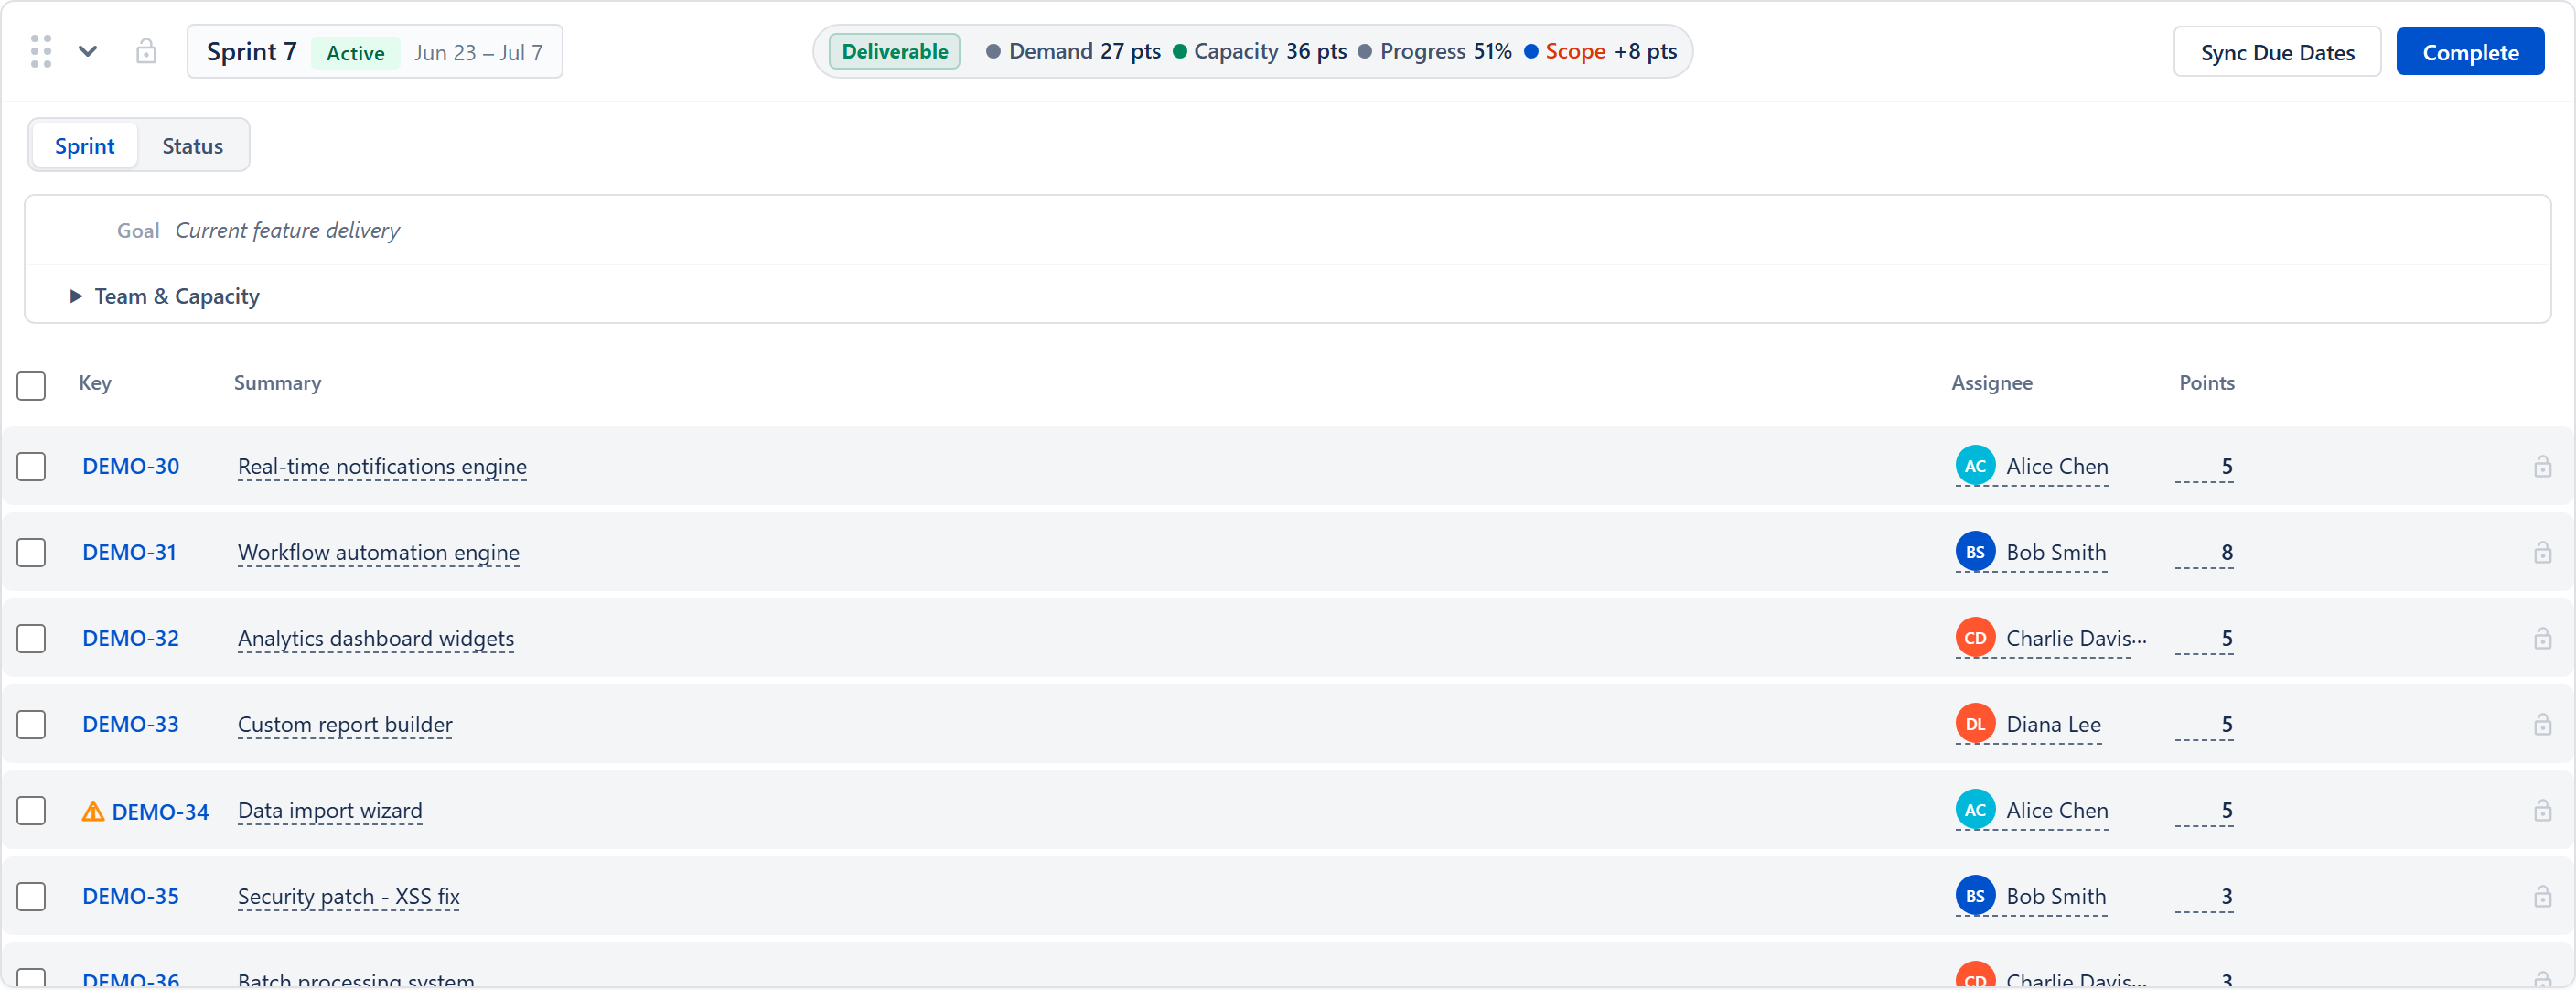
Every sprint, the backlog, and the virtual “Oversized Issues” row (when shown) renders as a sprint card with the same structure.
Header (always visible)
- Drag handle for reordering sprints up or down. The order is remembered.
- Collapse/expand chevron — per-sprint open/closed state is remembered.
- Sprint lock — pins every issue in this sprint during Auto-Level. Locked sprints also reject drops.
- Sprint name plus a state badge (Active, Future, or Closed).
- Clickable date range. Click to inline-edit the start and end dates; “No dates set” appears when missing.
Header stats (not shown for the backlog; the oversized row shows a compact "N total · No capacity" line instead):
- Deliverability badge — Deliverable, Tight, or Overcommitted. Closed sprints with all work finished show Delivered. The badge is a direct demand-versus-capacity check, so it always matches the demand and capacity figures shown beside it — on first render, after a drag-drop, and after an Auto-Level session. For an active sprint it answers "does the remaining work fit the capacity left in this sprint?" — see the Remaining demand / Remaining capacity stats below. Forward-looking pre-mortem confidence is shown in the Risks modal instead (see below), not in this badge.
- Risks button (future sprints only) — opens a Risks modal that lists risk factors and a suggested trim list of issues to defer.
- Demand — total work to deliver, in points, hours, or days. On an ACTIVE sprint the stat is labelled Remaining demand and counts only work not yet done.
- Capacity — the sprint’s effective limit, derived from the chosen capacity mode for this row. On an ACTIVE sprint the stat is labelled Remaining capacity: the effective limit scaled to the fraction of the sprint's calendar duration still ahead of today (a 36-pt sprint at its halfway point shows 18). Days already elapsed were spent on the work that is now done, so remaining work is judged against remaining time — a sprint can no longer read Deliverable on its last day just because its full-sprint capacity exceeds the open work. Sprints without dates can't be prorated and show the full limit; each active sprint (including parallel active sprints) is prorated by its own dates. The editable capacity value in the Team & Capacity section below stays the full configured limit — it is the setting, not the measurement.
- Progress — progress percentage (the stat is labelled Progress). Mode is configurable: by points, by remaining estimate, or by work ratio (time spent versus time spent plus remaining).
- Scope — scope ADDED since the sprint started, the same measure as the Status section's Scope Added: work pulled into the sprint after start, estimate increases, and issues created after start, read from each issue's Jira change history. When no change history is available it falls back to a start-of-sprint snapshot (demo data) or to issues created after start. Future sprints and the backlog show — (nothing can be "added" before a sprint starts). Red when positive, green when negative.
When the row is collapsed, the action buttons are hidden; the demand / capacity / Progress / Scope stats remain shown.
Action buttons (right-aligned, hidden during Auto-Level and when the row is collapsed):
- Sync Due Dates — pushes the sprint’s end date to every issue’s due date. Disabled when the sprint has no issues or no dates. Reports per-issue success and failure inline.
- Start Sprint (future only) — confirms with an explicit warning if another sprint is already active.
- Complete (active only) — opens the Complete-Sprint modal when there are incomplete issues, open action items, or risks ready to close. Otherwise a simple confirm.
- Delete (future only) — opens a destination picker if the sprint contains issues, otherwise a plain confirm.
Sprint and Status / Retro modes
Every non-backlog row has a two-button selector under the header. The sprint goal sits on the same row, to the right of the selector — click the goal text to inline-edit (Save or Cancel); because this row is shown in every mode, the goal stays visible in Sprint, Status, and Retro views. The Sprint button shows the planning body. The second button is state-aware:
- Future sprint — labelled “Status”, shows live progress for any work already underway.
- Active sprint — labelled “Status”, shows live actuals and projected metrics.
- Closed sprint — labelled “Retro”, opens the post-sprint retrospective. Closed rows default to this view.
Sprint mode body
Visible when the row is expanded and Sprint mode is selected.
Team & Capacity (collapsible, opens when the row expands)
- Full capacity row — labelled Full capacity: shows the configured limit. Click the value to inline-edit. On an ACTIVE sprint a read-only Remaining capacity figure sits beside the mode dropdown — the full capacity scaled to the sprint's remaining days, the same number the header stats and badge use. A dropdown lets the planner pick a capacity mode for this sprint:
- Project default — uses the project's Sprint Capacity from the Projects → Edit form.
- Team capacity — sum of all team members’ capacities for this sprint.
- Effective capacity (N%) — team capacity multiplied by historical efficiency. Listed when there is velocity history to compute efficiency, or when the mode is already selected; if no efficiency has been measured yet, the option and the header equation both read "(80% assumed)" so the standard-assumption fallback is never mistaken for a measurement.
- Custom — a planner-specified number for just this sprint.
- Per-member table — one row per assignee with Member, Total Demand, Completed, Capacity, and Status. On an ACTIVE sprint the capacity pair is Full Capacity (editable) and Remaining Capacity (read-only — the full value scaled to the sprint's remaining days); future sprints show the single Capacity column.
- Click a row to filter the table to just that user; click again or hit Show All to clear.
- A small “N blocked” badge appears when an assignee has blocked work.
- Capacity is editable inline. Right-click resets a per-user override.
- Status badge per member uses the shared load bands: OVERLOADED (> 115% of capacity), OPTIMAL (90–115%), AVAILABLE (60–90%), UNDERLOADED (< 60%) — the same bands as the Team & Capacity tab. On an ACTIVE sprint the band compares the member's remaining work against their capacity scaled to the sprint's remaining days (same rule as the header's Remaining capacity); the editable Capacity cell still shows the full per-sprint value.
Issue table
- Columns are dynamic — Key and Summary always show; Assignee, Points (or Hours/Days), Remaining Estimate, Original Estimate, Time Spent, Status, Type, Priority, Start Date, and Due Date can be enabled in project settings.
- Click any column header to sort ascending, again for descending, again to clear.
- Bulk select via header and per-row checkboxes. Selecting one or more issues opens a sticky toolbar at the top with: count of selected, Move to backlog, Set priority (Highest, High, Medium, Low, Lowest), and Clear.
- Drag any row to another sprint to move it. If the dragged row is part of a multi-select, the whole selection moves together. Drop on another row in the same sprint to reorder. Drop on the backlog area to move to backlog. Locked issues are filtered out of any drop. Auto-scroll kicks in near the top and bottom of the viewport during a drag.
Inline cell editing
Editable cells share a visual affordance: a dashed underline, a pointer cursor on hover, and a Click to edit … tooltip. The click target has a minimum width so cells that display 0, —, or an empty value are still easy to hit (previously zero-valued cells could collapse to a near-zero hit box and feel unclickable).
- Key — opens the issue in Jira. A warning icon appears when the issue is blocked by something in a later sprint.
- Summary — click to edit text. Enter saves; Escape cancels.
- Assignee — click to open a dropdown of the active team members plus Unassigned. The dropdown floats above the table on a portal layer so it is never clipped by row or table overflow. Optimistic update with rollback on error.
- Story points — click to edit (points mode only). Zero-valued and unestimated cells share the same dashed-underline hit target.
- Original Estimate — click to edit (time mode only; column header reads Time (hrs) or Time (days)). Same dashed-underline affordance; zero-valued cells are clickable.
- Status — click to open a transition list fetched live from Jira; No transitions available when none apply.
- Priority — click to choose from the five-level palette with coloured dots.
- Due date — click to open a date picker; past-due dates are highlighted on non-done issues.
- Time Spent and Remaining Estimate are read-only and formatted in hours or days.
- A warning icon appears in points, original-estimate, or remaining-estimate cells when an issue is larger than the sprint’s capacity.
- A per-row lock button keeps that issue in place during Auto-Level. During a session, moved issues show a small “← FromSprint” badge.
Quick Create issue
A “+ Create issue” link at the bottom of each sprint expands into a small form with an issue type dropdown (Story, Task, Bug, Sub-task), a summary input, and Add or Cancel. Hidden in read-only mode.
Status and Retro mode body
Visible when the row is expanded and the second mode button is selected — Status on a future or active sprint (a live, in-progress preview) or Retro on a closed sprint (the final review). The sprint's name shows above the review; there is no separate sprint dropdown — the row you expanded is the sprint. On an active sprint the sections that only make sense once the sprint closes — Talking Points, and parts of Insights — are locked until it ends.
This view reads the same sprint and velocity data the rest of the app uses, so its numbers match the sprint stats above and the Dashboard. It turns a sprint into a structured review for the scrum master or team lead: what was committed versus delivered, what slipped, the patterns behind it, and a set of follow-up actions.
Sprint Summary
A plain-language recap: how much was delivered of what was planned and the completion rate, how many issues and points carried over, and how many were added mid-sprint. It is the one-paragraph “what happened.”
Delivery Metrics
The same figures as a table — Planned, Delivered, Carry-over, Scope Added, and Completion Rate — each with the team's three-sprint average in a column alongside, so the sprint reads against its recent baseline. Note the deliberate difference from the header: Planned counts every issue in the sprint including finished ones (the committed size), while the header's Demand counts only unfinished work (what still needs capacity) — the two answer different questions and are not meant to match. When a closed sprint still has unfinished work and a next sprint exists, a Flag N issues for [next sprint] button appears here; clicking it surfaces those carry-over issues in that next sprint's Risk analysis.
Patterns
Observations the app raises automatically from the data — for example a clean sprint (no carry-over, no additions, good completion), a below-target completion rate, or recurring mid-sprint scope additions — each with a short, specific note.
Team Health Pulse
An overall health percentage plus three scored dimensions — Commitment vs Delivery, Scope Stability, and Estimation Quality — a quick read on how the sprint went beyond the raw totals.
Team Contribution
A per-member breakdown of who delivered what, with an Anonymize toggle for sharing the retro outside the team.
Insights
Two layers. First, deterministic insight cards drawn from the metrics — over-commitment, a buffer for recurring scope additions, an upward velocity trend, and a suggested next-sprint commitment of 95% of the team's recent three-sprint average delivered, shown labelled (P85 of recent velocity).
Then, when an AI provider and key are configured in Settings, an AI Insights button generates a short narrative analysis of the sprint from the same metrics. Below that summary is a follow-up chat: ask a question about the retro and it answers in a thread, carrying the conversation so each follow-up builds on the last answer. The conversation clears when you switch to a different sprint.
Talking Points
Discussion prompts for the retro meeting, drawn from the sprint's specifics. Locked during an active-sprint live preview, since they only make sense once the sprint has closed.
Action Items
A register of follow-up actions, each with an owner and a done or open status. Add an item, mark it done, or delete it. Action items persist with the sprint and also appear, globally, on the Actions tab. (Carrying unfinished work into the next sprint is done from the Delivery Metrics section's Flag … issues button, not here.)
Complete-Sprint modal
Opens when an active sprint is being completed and there are incomplete issues, open action items, or risks whose mitigation is fully done. Sections shown as needed:
- Incomplete issues — choose Backlog (the default), one of the existing other sprints (each shown with its current points total), or Create new sprint.
- Closeable risks — one checkbox per risk whose mitigation actions are all complete; tick to mark closed on confirm.
- Open action items — per-item radio with three choices: roll over to a chosen future sprint, mark done, or leave on this sprint. A “Roll all over” bulk control with a destination picker and Apply appears when there is more than one item.
Confirm executes the action-item dispositions, the risk closures, the issue moves (or sprint creation and move), and finally completes the sprint. The view refreshes on success.
Delete-Sprint modal
Future sprints with issues open a destination picker — Backlog or another sprint. Confirm moves issues, then deletes the sprint. Future sprints with no issues just show a plain confirm.
JQL Search
Above the sprint list. The planner can type a JQL query and press Enter or click Search. Results appear in a collapsible table (key with link, summary, assignee, points, status badge), capped at fifty rows. Clear resets the search.
A persistent Create Issue button sits at the right end of the row (hidden in read-only). It opens a popover with a project dropdown, an issue type dropdown, a summary input, and inline success or error feedback.
Backlog row
Sits below the sprints. Same card structure but with no header stats, no actions, no mode selector, and no per-user table — just the issue table and a count line. When empty, the backlog renders a drop zone so issues can still be dragged in.
Oversized Issues row
A virtual row that appears at the bottom of the sprint list during Auto-Level when one or more issues are larger than every sprint’s capacity. Capacity controls and drag are disabled. A banner explains that Backlog is recommended, and the planner picks a destination for each oversized issue at Accept time.
Cross-cutting modes and settings
- Estimation mode — Story Points or Time. Time mode swaps points for hours or days everywhere in the tab.
- Time unit — Hours or Days. Drives the displayed unit and the conversion of estimates.
- Capacity mode — Sprint limit or Per-user capacity. Per-user capacity mode tracks a per-assignee limit, flags individuals as overloaded, and shows the capacity editor as count × per-user.
- Per-sprint capacity — each sprint can be set to Project default, Team capacity, Effective capacity, or a custom number.
- Sprint and issue order — manual reordering of sprints and of issues inside a sprint is remembered.
- Read-only mode — hides Create Sprint, Quick Create, lock toggles, inline edits, drag, and batch actions. Auto-Level still runs but Save is blocked with a “preview only” notice.
- Program-All mode — the Sprints tab is hidden in favour of a notice asking the user to pick a single project.
- Locks — per-issue and per-sprint locks are honoured by Auto-Level (locked things never move) and by drag-and-drop (locked rows can’t be dragged; locked sprints reject drops).
How the numbers are computed
- Auto-Level (Sprint limit mode) — walks the open sprints in order, applies the chosen strategy to order issues, places each one into the first sprint where it fits, and never exceeds capacity. The ACTIVE sprint's capacity is its remaining capacity — the effective limit scaled to the days still ahead (same rule as the header stat) — so mid-sprint the engine moves out what genuinely no longer fits. Overflow spills into proposed new sprints, capped at a safe maximum. Locked issues stay put; locked sprints are skipped.
- Auto-Level (Per-user capacity mode) — tracks per-user demand inside each sprint, uses each user’s personal cap (scaled to the active sprint's remaining days, like the sprint-level rule), scans subsequent sprints for room, then proposes new sprints if needed. Same overflow guard.
- Effective capacity — team capacity multiplied by the team’s historical efficiency (delivered ÷ planned). When no efficiency has been measured yet, a standard 80% is used and the header marks the percentage as "assumed".
- Calculated capacity per sprint — comes from the Team & Capacity tab and contributes total points, total hours or days, and per-member capacities.
- Future-sprint confidence — a Monte Carlo simulation over velocity history, with adjustments for unestimated, large, and blocked items. Mapped through three confidence bands and surfaced in the per-sprint Risks modal (it no longer drives the header deliverability badge).
- Save — compares the staged plan with the original baseline, computes the net moves, and sends them to Jira along with any newly proposed sprints. Backlog moves are sent separately.
Effects on other parts of the app
- Demand by User: selecting a user filters work everywhere via the global user filter.
- Velocity Lookback: changing it here changes it for every tab.
- Include backlog: affects Auto-Level and every other view that consumes the backlog.
- Closing risks from the Complete-Sprint modal updates the global risk register.
- Action-item rollovers append the source sprint id to the action item so the destination shows the rollover provenance.
- Date sync writes individual issue due dates and triggers a refresh once finished.