 Project Commander Docs
← Back to site
Project Commander Docs
← Back to site
Team & Capacity Tab — Feature Guide
What it's for
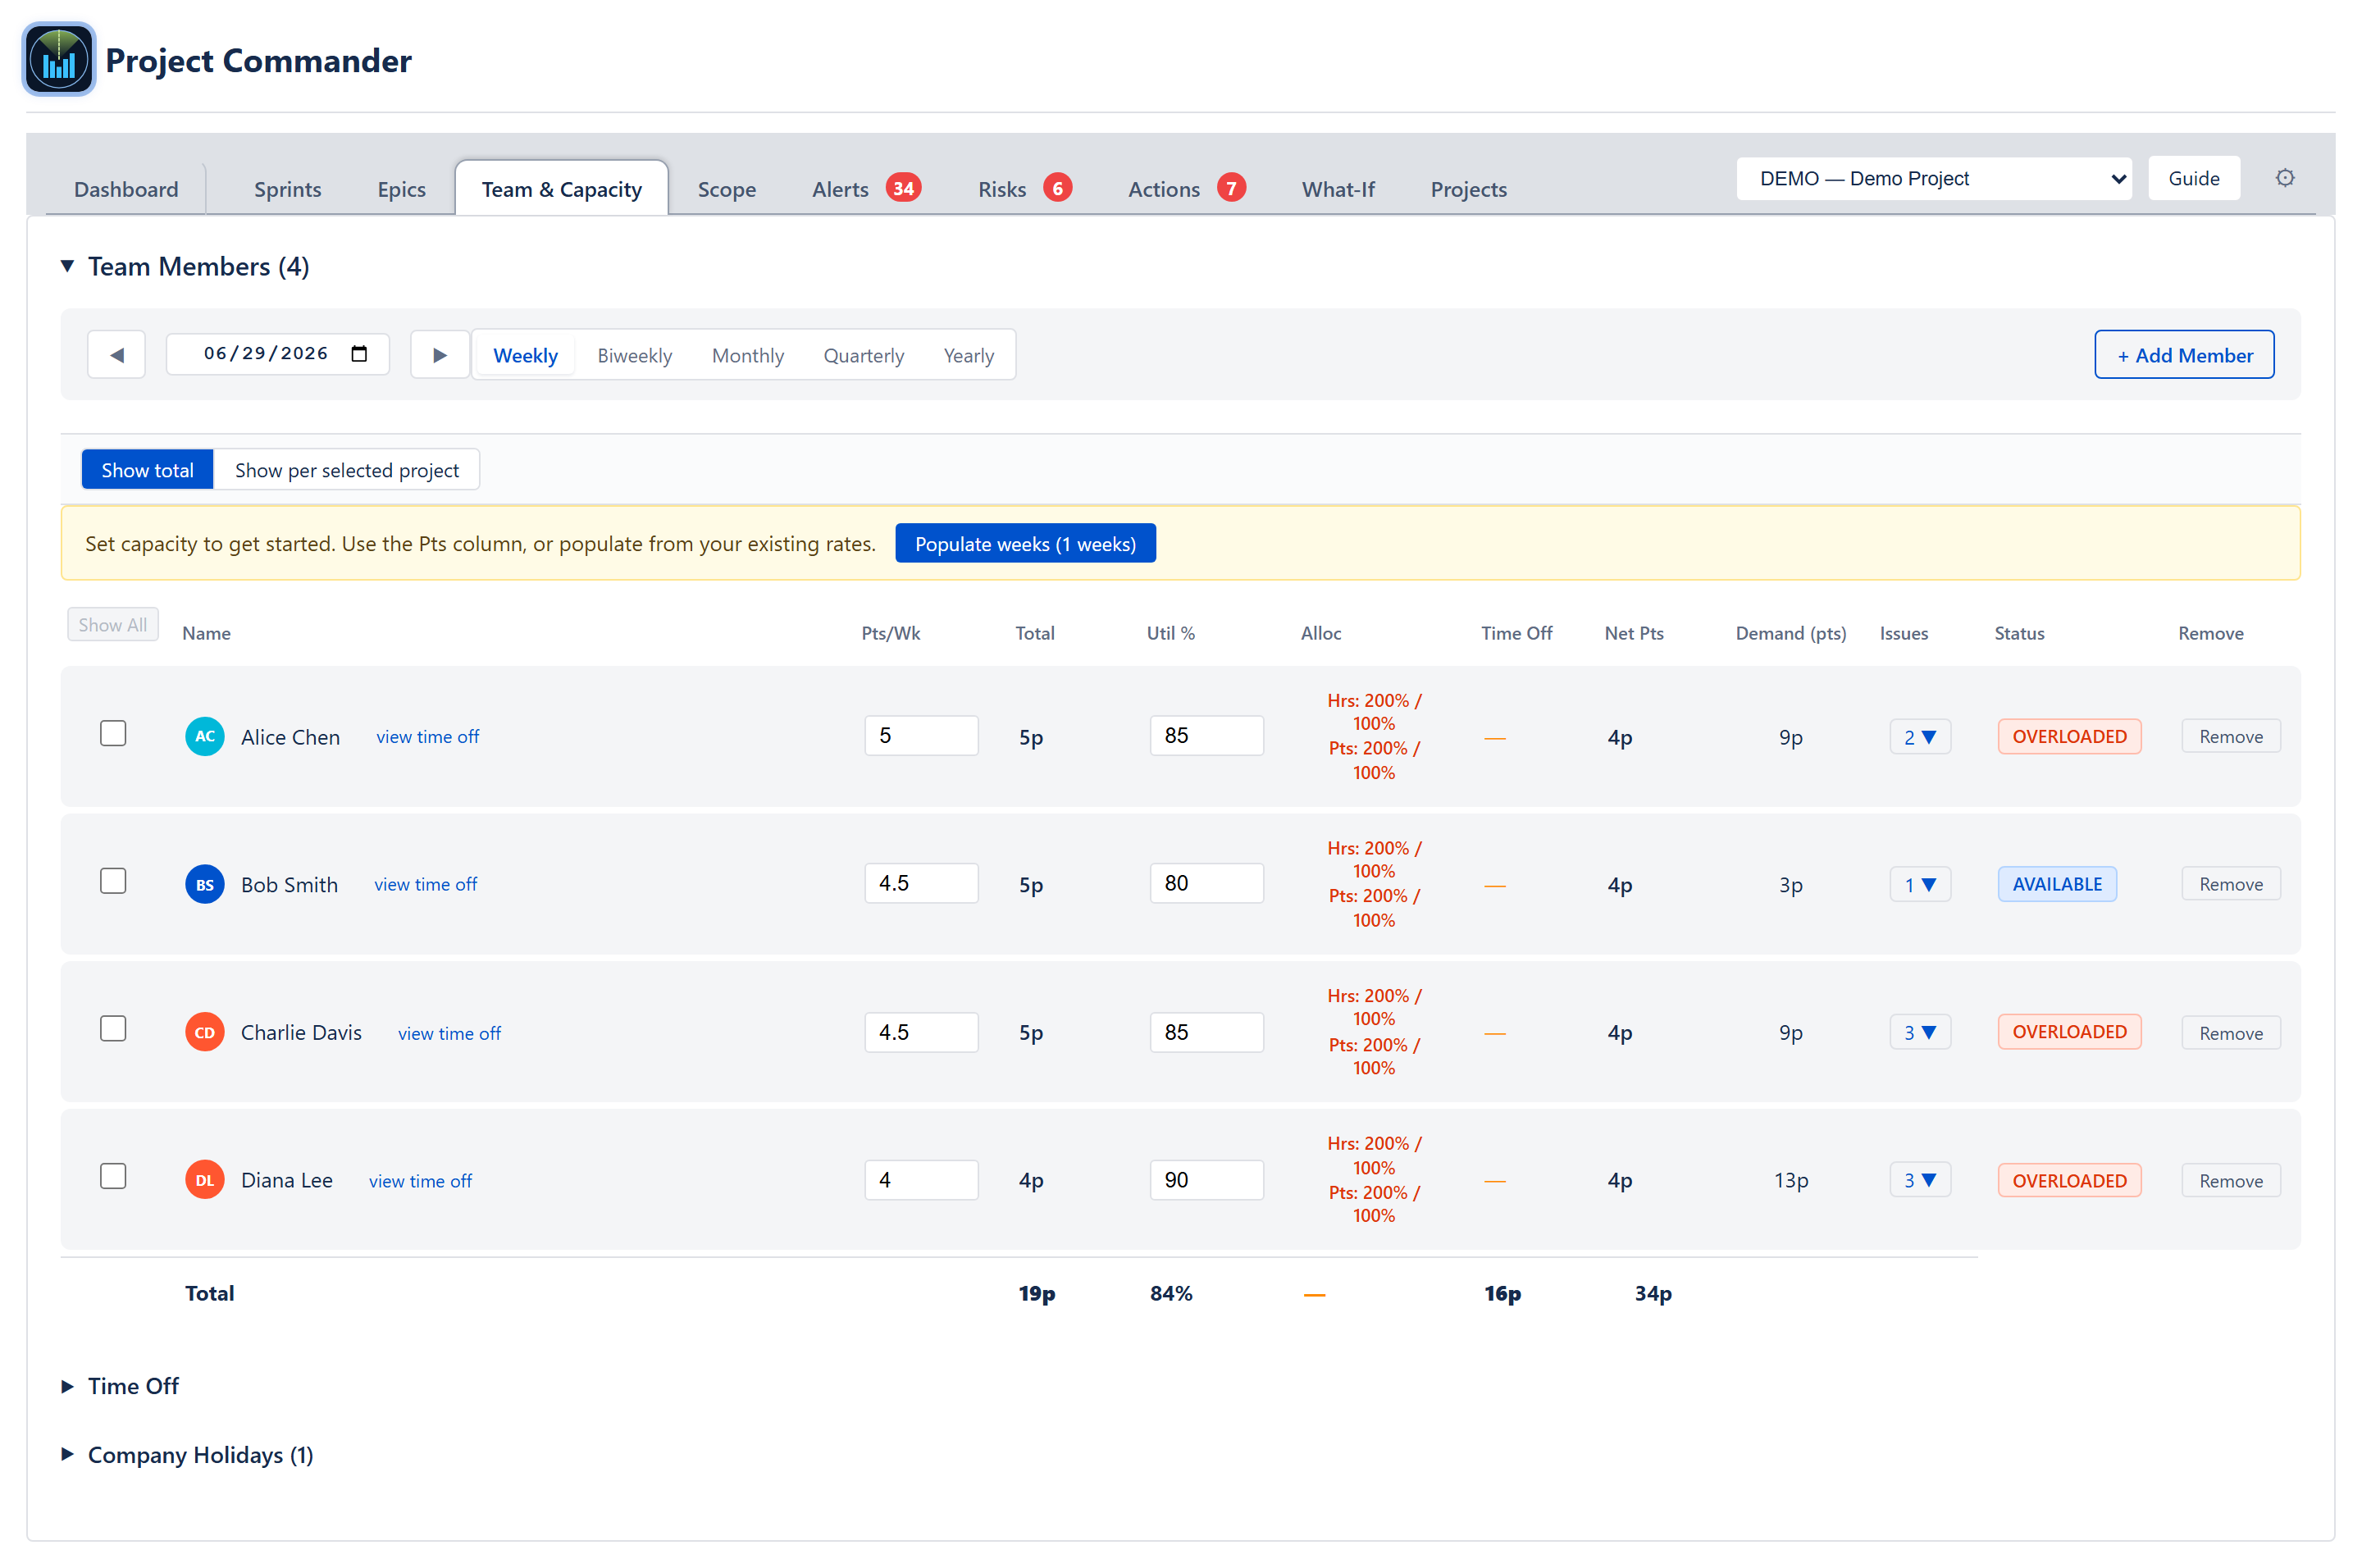
The Team & Capacity tab is where the team's roster, base capacity, time off, holidays, and per-project allocations are kept. Every other capacity-aware feature in the app — the forecast, the cascade chart, the feasibility score, sprint pre-mortem, weekly demand vs capacity, Auto-Level — reads its inputs from here.
The tab does four things: lets the user manage the team roster (add, edit, remove members); set base capacity in story points per sprint or hours per week, optionally with per-week overrides; track time off (PTO) and company holidays; and allocate each member's effort across multiple projects when programmes are configured.
The data is local-only — there is no Jira write-back for capacity. Removing a member, however, does unassign that person's open issues in Jira so the work doesn't silently stay on a person who is no longer on the team.
Header / Toolbar
Period selector
Five buttons across the top of the team table — Weekly, Biweekly, Monthly, Quarterly, Yearly. The choice changes how the table aggregates per-week capacity and how the table reads as bulk-edit input. Underneath, capacity is always stored per ISO week; the period view is a convenience for setting many weeks at once and for reading totals at the right granularity.
Period navigation arrows
Left/right arrows step the visible window forward or backward by one period. The current period label sits between the arrows.
"Populate weeks from legacy" banner
Appears whenever the team has no per-week capacity data yet (reading Set capacity to get started… Populate weeks). Clicking it backfills the per-week capacity map from the team's existing weekly-hours and points-per-sprint defaults so existing setups keep working. Once weekly data exists the banner is gone; it would reappear if that data were cleared.
Add Member button
A + Add Member button opens a dialog with a single Name field. The new member is created with defaults of 40 hours/week, 80% utilisation, and 10 points/sprint, which you then adjust inline in the table.
Show total / Show per selected project toggle
Visible only when programme projects are configured. Show total (the default) shows each member's full capacity. Show per selected project scales every capacity column by that member's allocation factor for the project currently selected in the main app's project picker. In project view, capacity and utilisation become read-only — they are scaled values, not stored values, so editing them would be ambiguous. Time off, holidays, and demand still display unscaled.
Team Members table
One row per member. Sticky-header table with the columns listed below.
Selection
- Select — a checkbox per row. Selecting a row filters the table to that single member; selecting again clears. A small bar appears above the table while a member is selected reading Showing 1 of N members with a Show All button.
Identity
- Name — the member's avatar (deterministic-colour circle with initials), the display name, and a view time off link that opens the per-member modal (described below).
Capacity (period bulk)
- Hrs/Pts per [Period] — the column header adapts to the period and estimation mode (e.g., Hrs/Wk, Pts/Mo). Editing this field sets every week in the period to the new value. When weeks differ already, the field shows a varies placeholder until the user types a replacement; committing a value re-flattens all weeks to that value. Internally still stored per ISO week.
- Total — the raw capacity across the period, before the utilisation factor and before time-off deductions (those are applied later, in Net). The unit suffix is h for hours (or d for days when configured) and p for points.
- Util % — utilisation as 0–100. Uses the same per-week storage and bulk-edit pattern as capacity.
Allocation (programme projects only)
- Alloc — a button labelled with two stacked totals,
Hrs: X% / 100%andPts: Y% / 100%. The totals are colour-coded grey when ≤ 100% and red when over-allocated. Clicking opens an inline popover (see Allocation popover below).
Time off and holidays
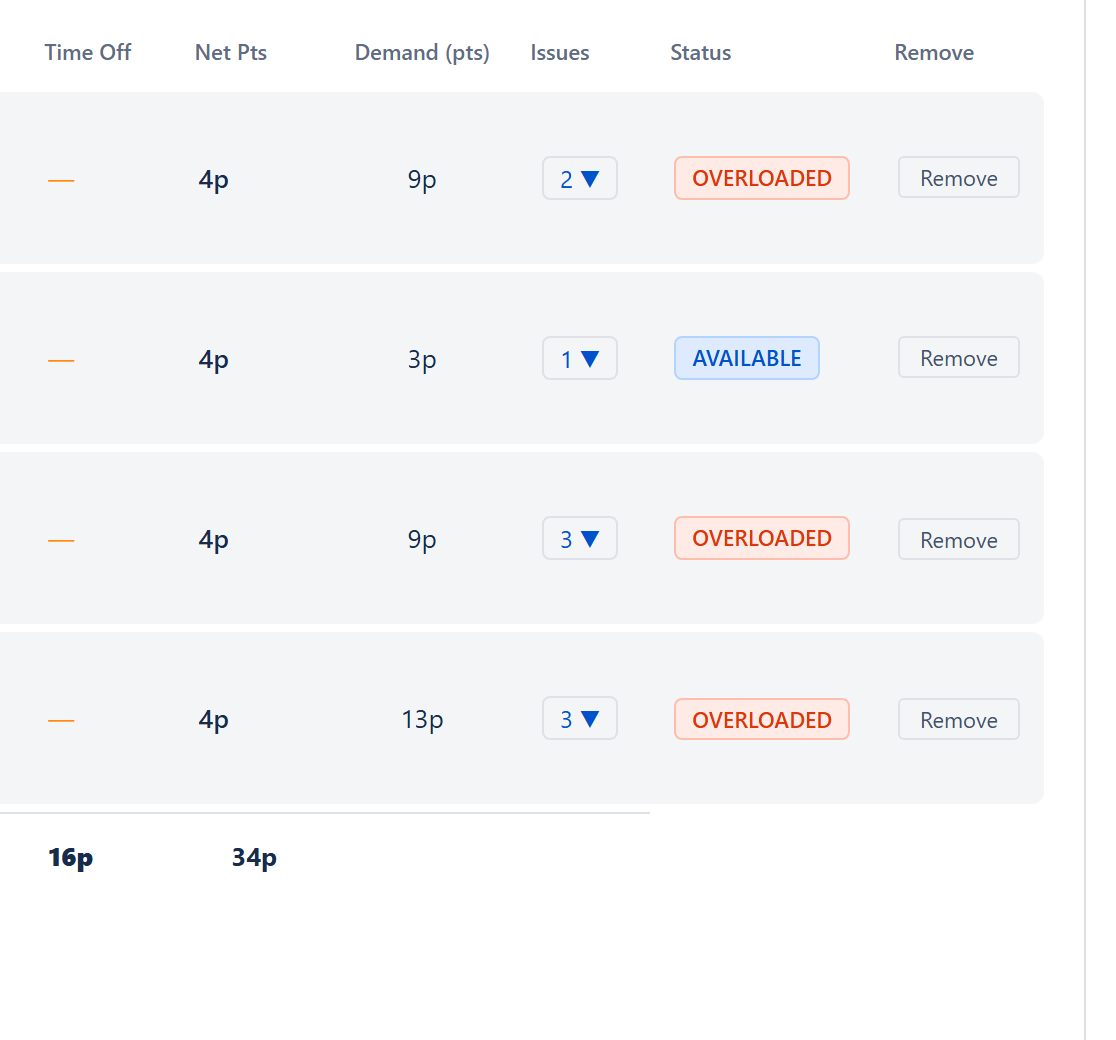
- Time Off — total hours deducted in the period for PTO + holidays, summed. The cell is a button when the value is non-zero; clicking it expands an inline detail row (described below).
Net capacity
- Net Pts / Net Hrs — capacity after both utilisation and time off subtractions, floored at zero, for the WHOLE selected period. This is the value forecasts and feasibility scores read.
- Remaining Pts / Remaining Hrs — read-only: the net capacity scaled to the part of the selected period still ahead of today, using the same linear day-fraction rule as the sprint cards and the Scope tab's Resource Breakdown (ruling 2026-07-10). A period wholly in the past reads 0; a wholly future period equals the Net value. This is what the Status badge judges demand against — capacity on days already gone can't absorb open work.
Demand
- Demand — sum of the member's assigned-and-not-done estimates that overlap the visible period.
Issue count and inline expand
- Issues — count of non-done assigned issues. A button when non-zero; clicking expands an inline detail row listing each assigned issue with key, summary, and points.
Status badge
- Status — one of OVERLOADED (red), OPTIMAL (green), AVAILABLE (blue), UNDERLOADED (orange). The decision compares total demand against the REMAINING net capacity (the Remaining column — the period clipped to today-forward, ruling 2026-07-10) using the load thresholds — broadly: > 115% OVERLOADED, 90–115% OPTIMAL, 60–90% AVAILABLE, < 60% UNDERLOADED. Open work against a period with nothing left reads OVERLOADED. (The Sprints tab's per-member status column uses these SAME four bands, judged against the member's remaining sprint capacity, so a person reads the same status logic on both tabs.)
Removal
- Remove — a Remove button; clicking it swaps the cell to inline Yes / No buttons. Confirming with Yes removes the member from the team and unassigns any non-done issues currently assigned to them in Jira.
Per-member detail rows
Three independent inline expansions:
Issues detail
Lists every non-done issue assigned to the member that overlaps the period, with Jira key, summary, and points.
Time off detail
Lists every PTO entry and holiday in the period, each with its date, reason, and hours. There are no inline delete buttons in this detail row — remove time off from the calendar or the per-member time-off modal, and holidays from the Holidays section.
Allocation popover
A floating panel anchored to the Alloc button. Lists every programme project by key in a four-column grid (rows wrap when more than four projects exist). Each project card has two fields: a percent input (the share of this member's capacity dedicated to that project) and an editable "= X" line that shows the computed absolute, labelled with its period — pts/sprint for points-mode projects and h/wk for time-mode — so the figure never reads as a doubling of the per-week Pts/Wk value in the row above. Edit either field and blurring persists the change; the other field recomputes from the member's current capacity. The popover header shows Project allocations and a close button. Two Σ chips at the bottom row sum the percents per unit — Σ Hrs: X% / 100% and Σ Pts: Y% / 100% — both turning red with a ⚠ marker when totals exceed 100%. The popover stays open when you switch back to Show total; it closes only on an outside click, Escape, the close button, or re-clicking the Alloc cell.
Percent storage is the source of truth: when the member's Pts/Wk or Hrs/Wk is edited in the row above, every "= X" computed value in their popover updates immediately without any allocation edit. A 60% allocation stays 60% across capacity changes — that's the intent the planner expressed, not the absolute value.
Zero-allocation confirm
When the user edits an allocation cell down to zero (in either the matrix on the Projects tab or this popover) and the affected member still has unfinished work assigned to that project, a ConfirmDialog opens before the change saves. The title reads Zero allocation with assigned work; the message names the member, the project key, and the count of unfinished issues, then asks whether to continue (e.g., "Sarah Chen has 3 unfinished issues assigned in AUTH. Setting allocation to 0 will leave them with no capacity for this project. Continue?"). The user picks Cancel (allocation reverts to the previous value) or Set to 0 (allocation is zeroed and the forecast recomputes). It does not fire when the member has no open issues on the project — there is nothing to warn about.
Per-member time-off modal
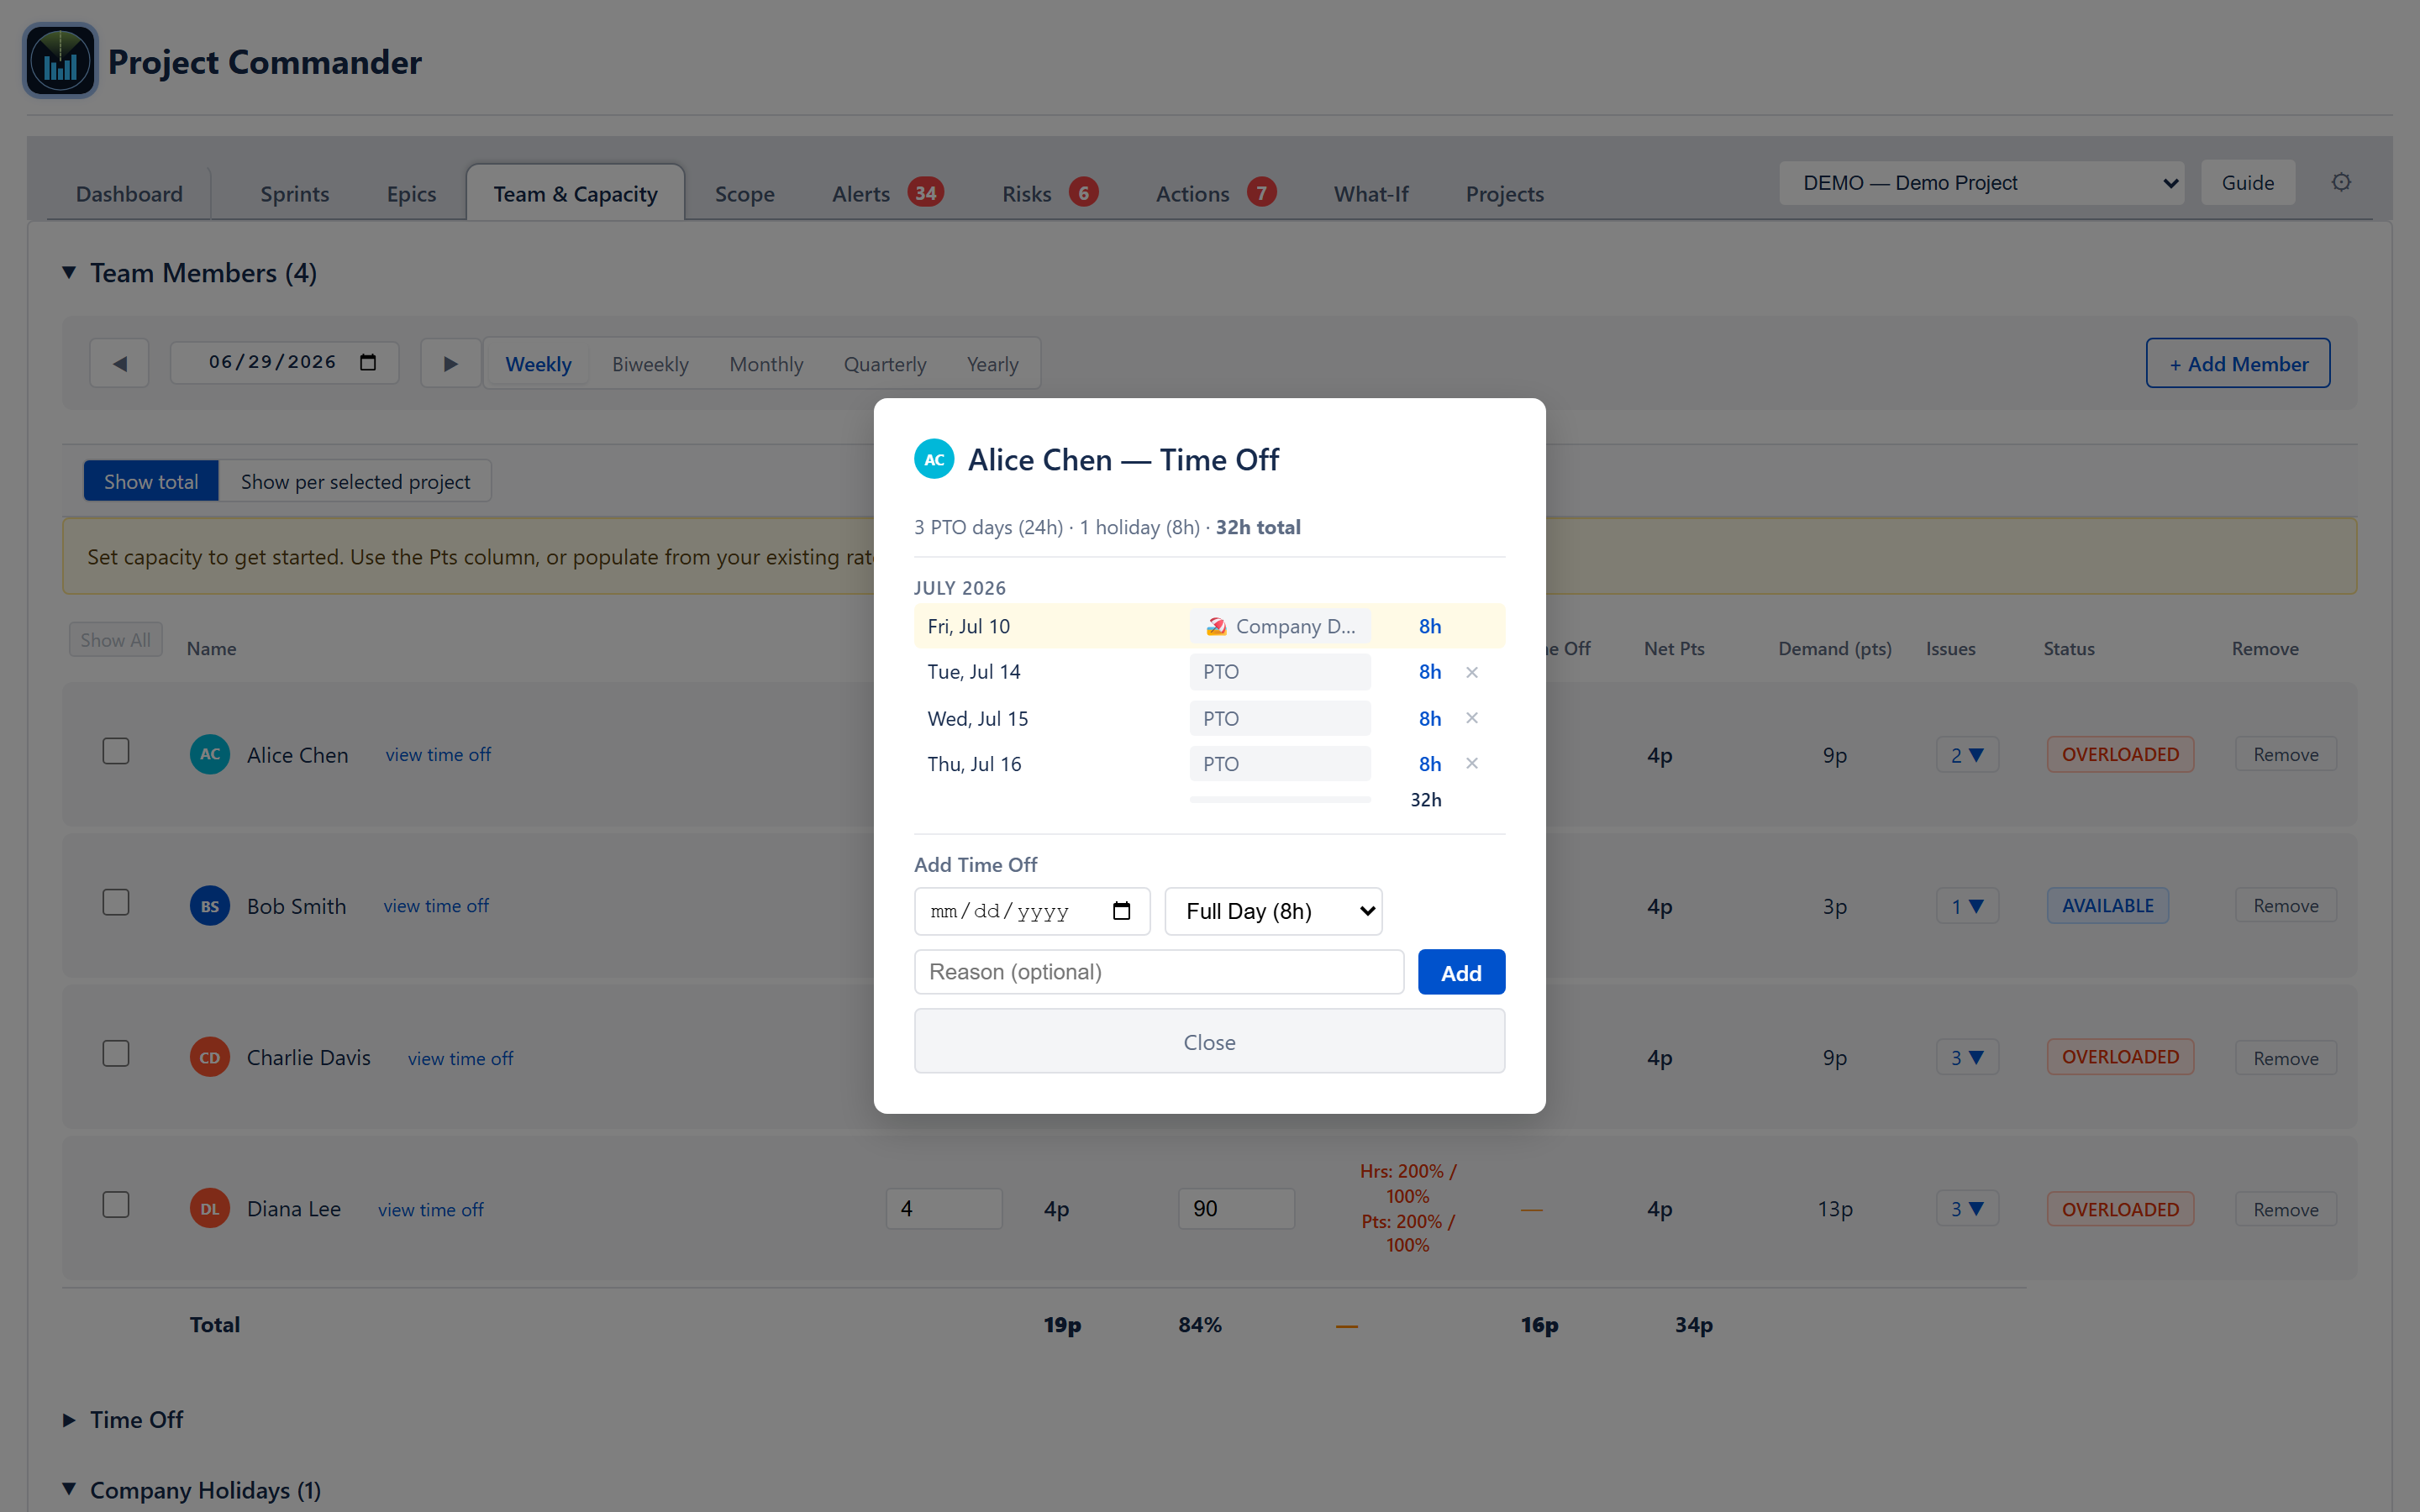
Reached by the view time off link on the member's name. Full-screen modal with four parts:
- Header: avatar, name, Time Off label.
- Summary line counting PTO days, holidays, total hours.
- Month-grouped sections (static headers, not collapsible), each listing entries for that month with date, reason, hours.
- Add Time Off form at the bottom: date picker, a duration dropdown (Full Day / Half Day / 2h / 1h), optional reason, an Add button.
Useful for entering a year of PTO upfront or for spotting clashes with a release window.
Time Off calendar section
A collapsible section beneath the team table. Contains a month-view calendar plus controls for bulk multi-day time-off entry.
Calendar navigation
Independent period bar with left/right arrows; the calendar's month is decoupled from the team table's period. Useful for editing forward time off while reading current-quarter capacity.
Member filter
A Show checkbox row letting the user filter the calendar to one or more team members. Clear resets to all members.
Legend
Four day colours: weekend (light grey), holiday (light blue), time off (light orange), selected (light green with a green outline).
Day selection
Click a non-weekend day to select it. Ctrl-click toggles a day in or out of the selection. Shift-click selects a range from the last clicked day to the current day, skipping weekends. While days are selected, three buttons appear: Add Time Off (opens the bulk-add modal), Delete Time Off (removes any PTO entries on selected days), Clear (deselects).
Add Time Off bulk modal
Triggered from the selection action bar. Shows the chosen date range, lists each selected day as a chip (with an H badge for any day that already has a holiday), allows the user to pick a member, set hours-per-day from a dropdown, type a reason, and confirm. The modal also has a collapsible Mark as Company Holiday form for declaring the same selection a holiday — shown unless every selected day already has a company holiday.
Company Holidays section

A collapsible list. Each row shows date (formatted as Mon, Jan 1), name, an optional 🔄 recurring badge for yearly holidays, and Edit / Delete buttons. The Edit button switches the row into inline edit mode (date input, name input, Yearly checkbox, Save / Cancel). The Delete button removes the holiday immediately. The Add form at the bottom takes a date, a name, and a Yearly checkbox; submitting persists the holiday. Duplicate dates are silently ignored.
Holidays apply company-wide and are deducted from every member's net capacity automatically.
Total row
The last row of the team table aggregates across the visible (filtered) members.
- Total — period capacity sum.
- Util % — capacity-weighted average of utilisation.
- Time Off — total hours of PTO + holidays across the team.
- Net — total available capacity after deductions.
- Demand — total assigned non-done estimate.
In Show per selected project mode, capacity and Net are scaled by per-member allocation factor; time-off, holidays, and demand totals remain unscaled.
Demand-vs-Capacity feed (no chart in this tab)
The Team & Capacity tab itself does not render the cascade or feasibility chart. Once configuration is saved, the weekly bucketing engine reads the same data and feeds the Plan-Risk weekly grid, the cascade bar chart in What-If, and the feasibility scores on the Sprints tab. The link is one-way: configure here, see results elsewhere.
Estimation mode and time units
The whole tab adapts to the project's estimation mode:
- Points mode — Hrs/Pts per [Period] column header reads Pts/[Period]; capacity and demand are points; the Total row uses p.
- Hours mode — header reads Hrs/[Period]; capacity and demand are hours; h (or d when the project is configured in days) suffix.
Per-week capacity is stored in whichever unit the project is in; switching modes does not convert stored values automatically.
Data persistence
Saving writes the entire roster + holidays + PTO + allocations as one record into the project's persistent store. Changes are saved on blur and on dialog confirm. There is no explicit Save button.
Removing a member unassigns that person's open issues in Jira — the only Jira write the tab makes. All other edits are local.
Cross-cutting modes and settings
- Estimation mode — controls units and column headers globally.
- Sprint mode on/off — when off, points-per-sprint fields are hidden in the + Add Member dialog and the Capacity column reverts to hours-per-week semantics in the Total row.
- Programme (multi-project) mode — unlocks the Allocation column, the Show per project toggle, and the allocation popover.
- Viewing all projects at once — the allocation popover is hidden because there is no single project to scale capacity by.
How the numbers are computed
- Net available capacity formula — see ALGORITHMS Appendix → Capacity and Demand (Net Available Hours, Net Available Points).
- Utilisation bands — see ALGORITHMS Appendix → Utilisation Ratio. Bands: > 115% Overloaded, 90–115% Optimal, 60–90% Available, < 60% Underloaded — judged against the Remaining column (period clipped to today-forward).
- Allocation factor — see the ALGORITHMS Project Allocation section (Per-Member Allocation Factor, and Allocation in Scenarios and Cascades).
- Weekly bucketing — section 5 and the Plan Risk Weekly Bucketing reference.
- ISO-week proration — see ALGORITHMS Foundation Utilities → ISO Week Conversion for how partial weeks are handled.
Effects on other parts of the app
- Forecast (Dashboard, Scope, What-If) — every capacity provider used by the deterministic forecast and Monte Carlo reads its hours/points and utilisation from this tab.
- Plan-Risk weekly grid and cascade chart — read holiday, PTO, weekly capacity, and per-week demand directly.
- Auto-Level — per-developer capacity caps configured here keep each person within their limit when Auto-Level balances work. (One balancing strategy that respects these per-person caps exists in the engine but is not shown in the Auto-Level menu and is not auto-selected; see ALGORITHMS §6.)
- Sprints tab — the per-sprint header (Demand vs Capacity, Deliverable / Tight / Overcommitted) reads its capacity from the resolved net-capacity values for the sprint window.
- Programs tab — the team allocation matrix is the same data shown there; editing in either place updates the same store.
- Risks engine — the Single-person load, Capacity hit, and Velocity decline detectors read base capacity and PTO out of this tab.