 Project Commander Docs
← Back to site
Project Commander Docs
← Back to site
Projects Tab — Feature Guide
What it's for
The Projects tab is the programme view: every project the team is running side-by-side, plus the team allocation matrix that splits people across them, the cross-project dependency declarations that propagate slips between them, and the cross-project Critical Chain that finds the longest constrained path across the portfolio.
Four things live in one tab: register a new project, edit per-project settings, see a read-only portfolio dashboard with per-project health, and declare and watch cross-project blocking dependencies. The portfolio table is a monitoring view — it reports each project's forecast, slack, utilisation, and alerts and does not edit them inline. To model "what if" changes across the portfolio (adding people, scope growth, a slowdown), use the What-If tab's All Projects view, where sliders and a Monte Carlo simulation update the whole-program forecast and odds.
The audience is programme managers, portfolio leads, and engineering directors. A single project's view is on the Dashboard; this is where multiple projects meet.
Programme model
A programme is a set of related projects plus a shared team and the allocations between them. Each programme contains:
- Projects — registered with a Jira board ID and a JQL filter that defines membership.
- Team members — pool of people with base capacity (hours per week, points per sprint) drawn from the Team & Capacity tab.
- Allocations — per (member × project) entries stored as a percent of capacity, with hours and points kept as independent percents (a member can be 50% on hours and 60% on points for the same project, intentionally). The percent is the source of truth and survives capacity changes without rebalancing; the matching absolute "= X" is recomputed from it and labelled with its period (pts/sprint for points, h/wk for hours).
- Dependencies — declarative project A blocks project B statements.
Toolbar / header
- + Add Project — opens the project registration form.
Add Project form
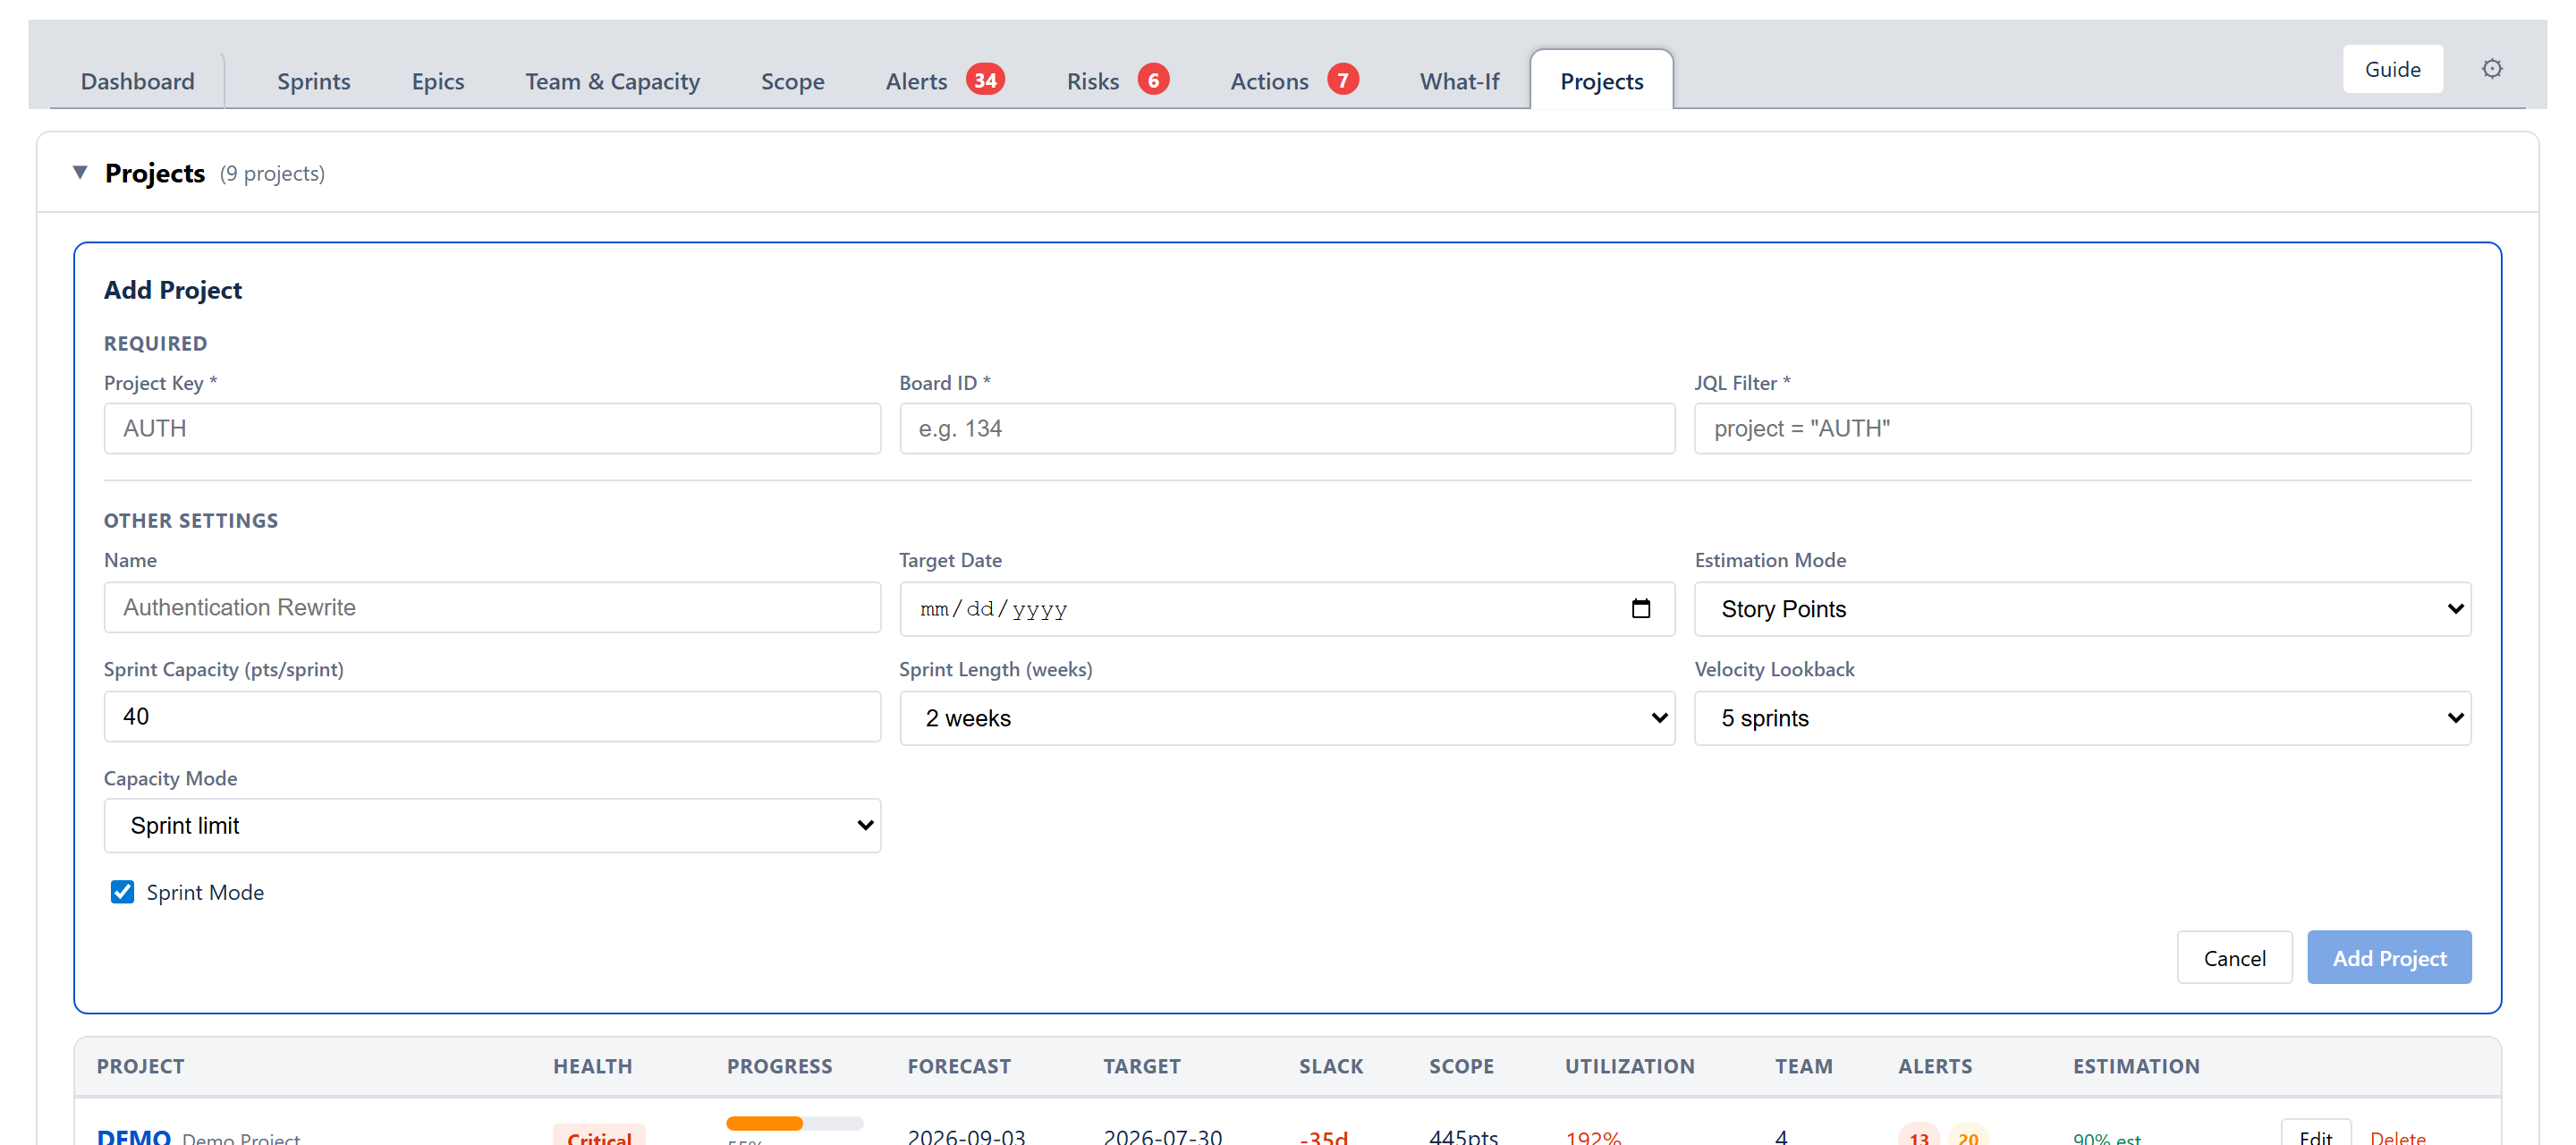
Required fields:
- Project Key — short uppercase id (e.g., AUTH).
- Board ID — Jira board id; the engine fetches sprints and issues from this board.
- JQL Filter — Jira-Query-Language filter selecting the issues that belong to the project.
Optional settings:
- Name — human-readable (defaults to the key).
- Target Date — used to compute
slack = target − forecast. - Estimation Mode — Story Points or Time. When Time is chosen, a Time Unit picker appears for Hours or Days (1 day = 8 hours); the choice is saved per project and every screen shows that project's time estimates and capacity in the chosen unit.
- Sprint Mode — on by default; when off, the project is treated as a continuous backlog.
- Sprint Capacity — points / hours / days per sprint default; the field label follows the project's estimation unit.
- Sprint Length — 1 / 2 / 3 / 4 weeks.
- Velocity Lookback — how many recent sprints are averaged for rolling velocity: any number from 1 to 10, the same shared value the Delivery forecast card's gear ("Use last N sprints") edits on the Dashboard, Scope and What-If tabs.
- Capacity Mode — Sprint limit or Per-user capacity.
Add Project persists the new entry into the programme store and triggers a fetch.
Edit / Delete
Each project row has Edit and Delete buttons. Edit lets the user change any setting; only the project key is required so settings can be edited even when board ID or JQL are missing. Delete opens a ConfirmDialog; on confirm, the engine removes the project and cleans up its allocations and dependencies.
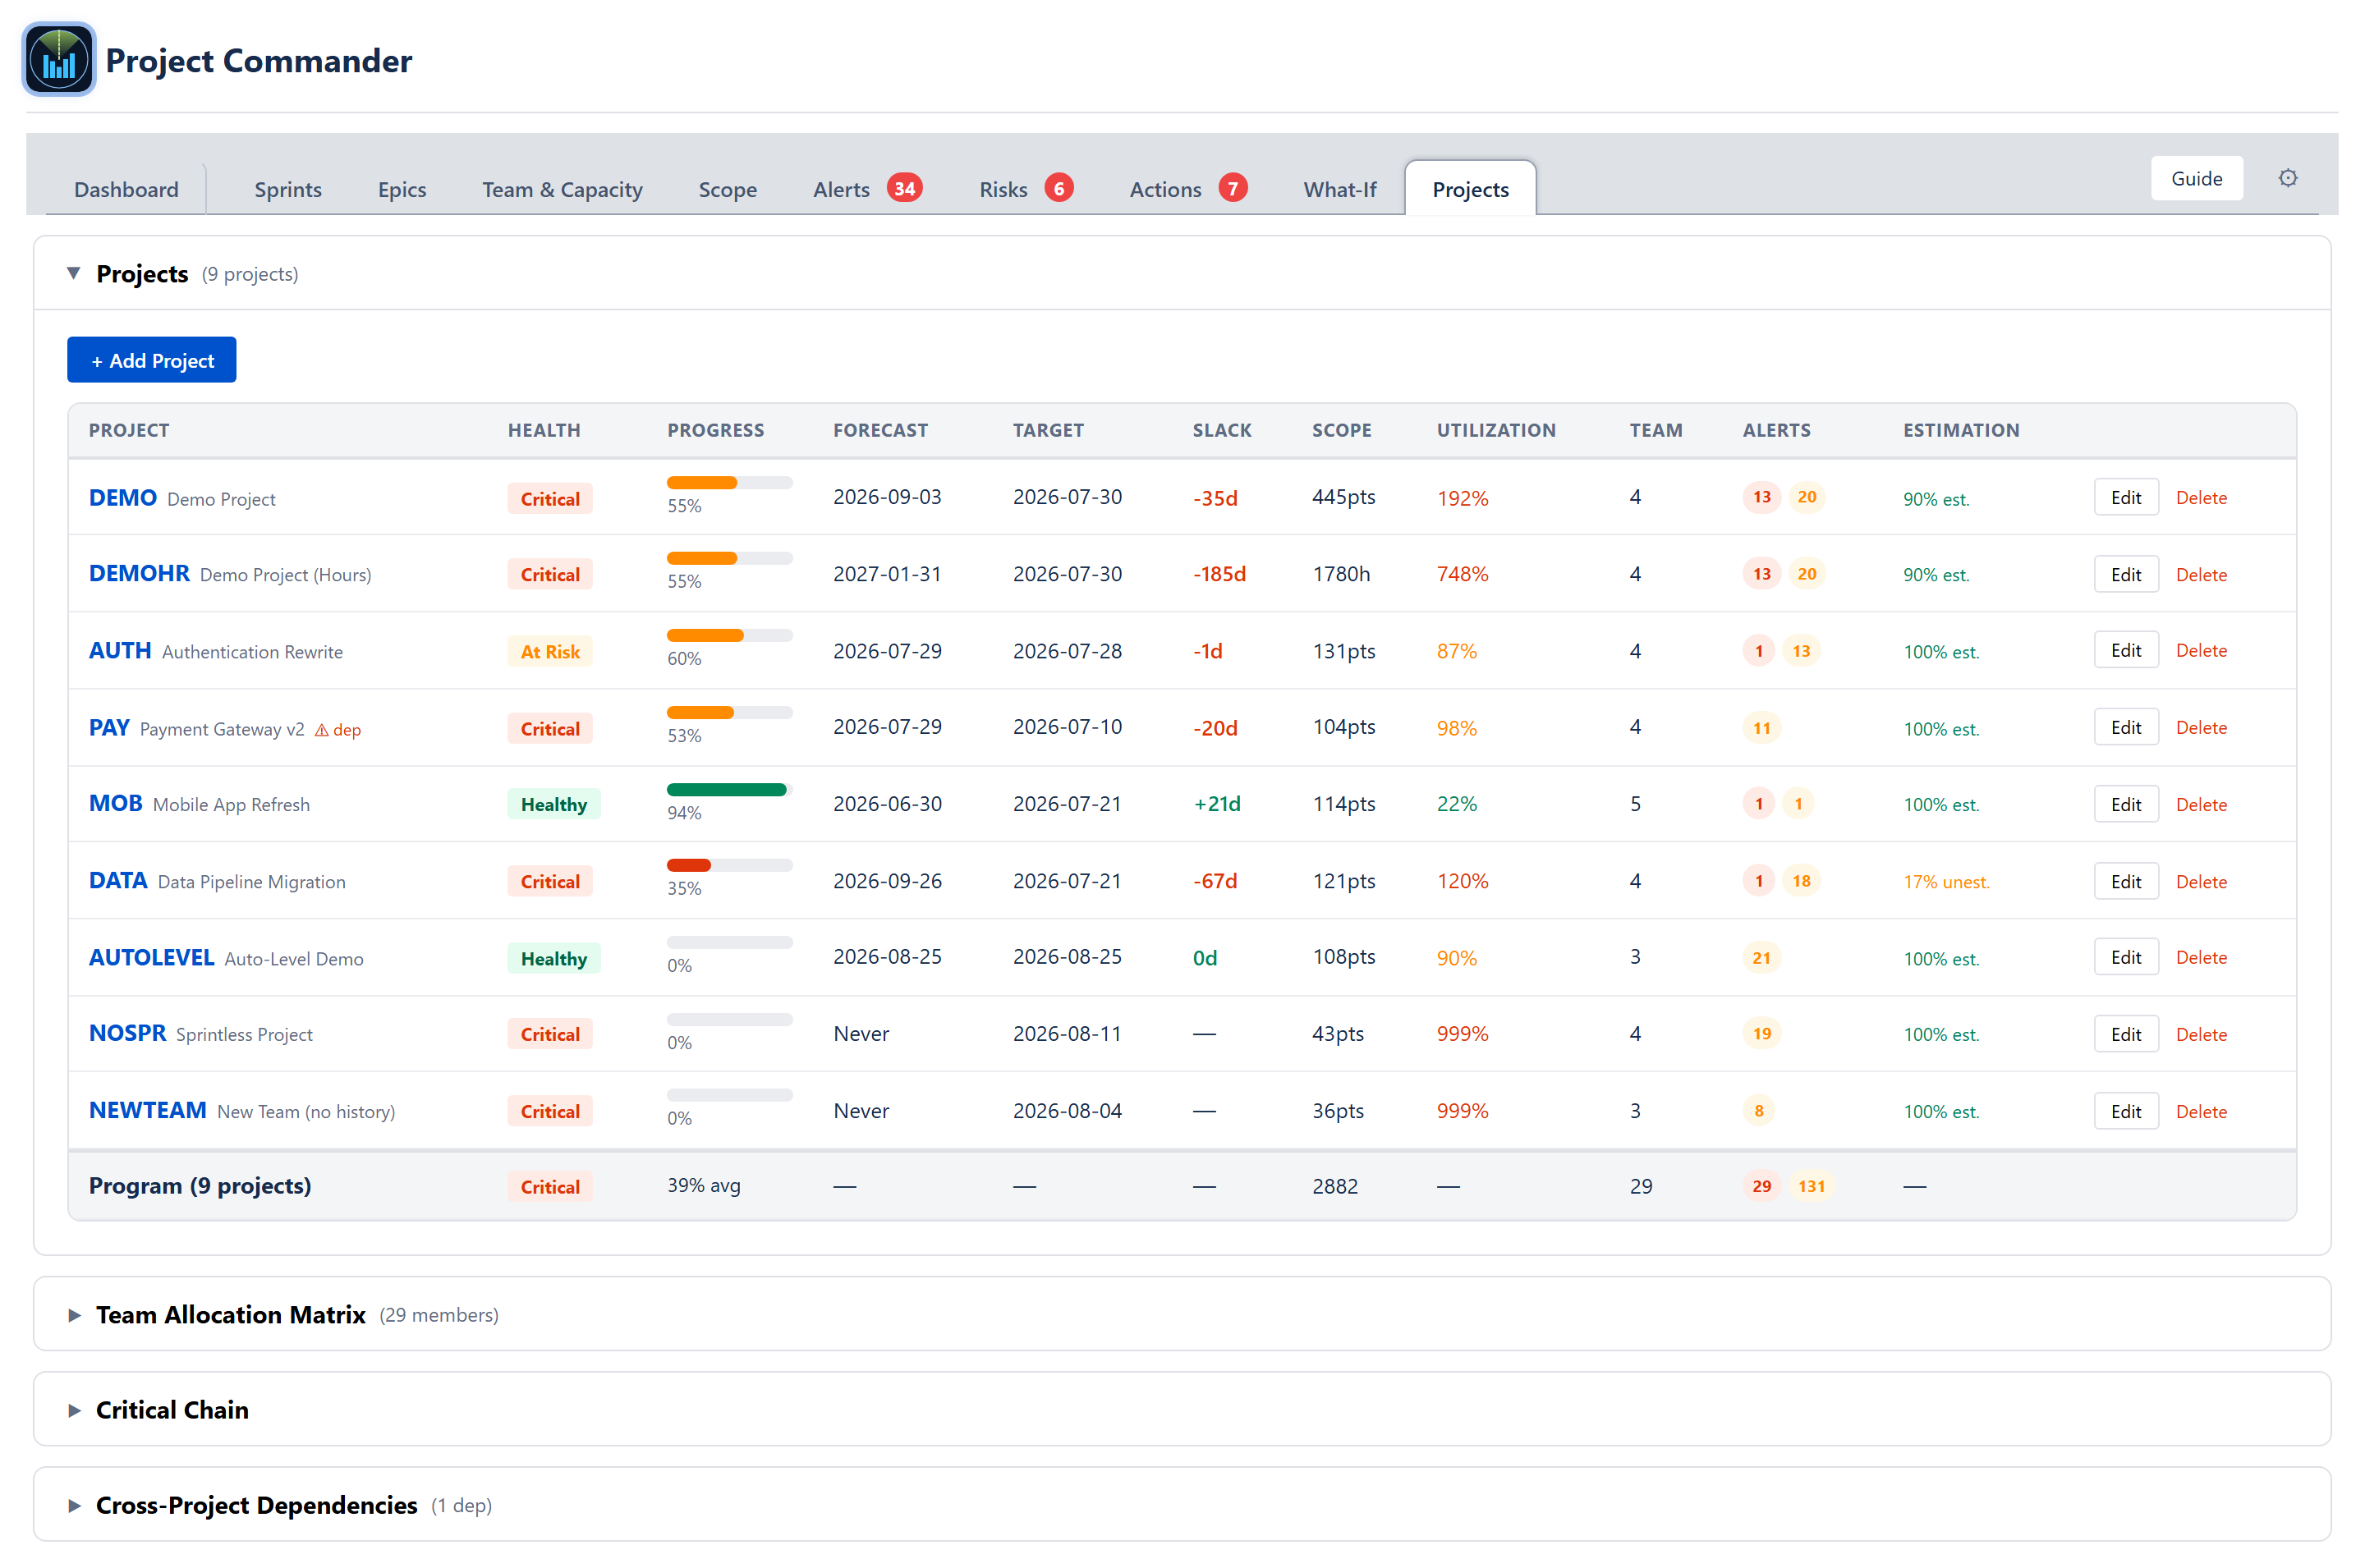
Portfolio dashboard table
One row per project. Columns:
- Project — uppercase key + name. A red ⚠ dep badge appears when the project has an active dependency violation.
- Health — coloured pill: Healthy (green), At Risk (orange), Critical (red). Hovering shows the exact reason.
- Progress — bar + percentage of issues complete (done estimate ÷ total estimate).
- Forecast — the projected completion date, Never when the plan can't finish, or — when there is no projected date.
- Target — read-only here; a project's target date is set on its Edit form (the Add Project / edit dialog), not in this cell.
- Slack — calendar days between forecast and target. Green when ≥ 0, red when negative.
- Scope — total estimate of in-scope issues, including done work, read-only. To model a scope change, use the What-If tab's All Projects view.
- Utilisation — % of active sprint capacity committed; green < 85, amber 85–100, red > 100.
- Team — count of active team members on the project, read-only. Team size comes from the registered members and the allocation matrix; to model adding or moving people, use the What-If tab's All Projects view.
- Alerts — N blockers · M warnings counts from the alerts engine; Clear when zero.
- Estimation — % of active issues with an estimate. Green when more than 90% are estimated; orange when more than 10% are unestimated. (The project drill-down's Data Quality card shows the same figure, turning red when more than 20% of active issues are unestimated.)
- Actions — Edit, Delete.
The portfolio table is a read-only monitoring view: every cell reports a value, and the only interactive controls on each row are the Edit and Delete buttons.
Programme rollup row
When at least two projects exist, a footer row sums the portfolio:
- Programme (N projects) — label.
- Health — Critical if any is critical, At Risk if any is at-risk, else Healthy.
- Average Progress.
- Total Scope — sum across projects, with unit suffix only if every project shares the same estimation mode.
- Total Team — count of registered team members.
- Alerts — aggregate blockers and warnings.
Team Allocation Matrix
Below the project table, a members × projects grid. A couple of internal demo-only projects are hidden from this grid.

- Rows — every registered team member.
- Columns — every visible project.
- Capacity column — base capacity per member: hours/week and points/sprint.
- Status column — running percent totals across visible projects, Σ Hrs: X% / 100% and Σ Pts: Y% / 100%. When over 100% the row is red with an "over by N%" callout; both units fire over-allocation independently.
Cell contents (read-only here)
Each cell shows two stacked values, read-only on this tab:
- Percent — the share of the member's capacity dedicated to that project (e.g., 50%). The unit matches the project's estimation mode — points for points-mode projects, hours for time-mode.
- Computed "= X" line — the absolute value the percent works out to at the member's current capacity, labelled with its period (pts/sprint for points, h/wk for hours).
To change an allocation, use the Alloc popover on the Team & Capacity tab, where editing either the percent or the "= X" value updates the other and saves immediately to the same program store. Storage is percent; both unit percents are persisted independently, so toggling a project's estimation mode never loses data.
Over-allocation
The matrix does not clamp totals. Over-allocation is preserved verbatim and surfaced through the Status column's red text, so the cost of putting Sarah on five projects is visible rather than silently capped. Forecasts respect the actual loaded allocation, so the consequences of over-allocation show up in the per-project utilisation and forecast columns.
Capacity-change live update
Changing a member's hours per week or points per sprint (in the Team & Capacity tab) immediately updates every "= X" display in this matrix and the Alloc popover, without re-entering any percents. A 60% allocation stays 60% across capacity changes — that's the intent the planner expressed, not the absolute number.
Feeds the program Delivery Forecast
The per-project allocation set here is also applied when the Delivery Forecast rolls a program up — the Program View on the Dashboard and Scope, and the All Projects sub-view on What-If. Each project is forecast on its team's allocated capacity, so a person split across projects counts at their share on each project rather than at full capacity on every one (which would make the program look faster than it is). Set the real split here for a true program forecast; a person left at 100% on more than one project is still counted in full on each.
Critical Chain panel
A collapsible Critical Chain section sits below the project table and shows the longest, most-constrained path of work that determines the programme end date. It is the same engine documented in ALGORITHMS section 7 (Critical Chain) — chain confidence, per-resource summaries, feeding paths, due-date risks, epic grouping, and team-pool overflow. When in Program All mode the chain is computed across every registered project; otherwise it is filtered to the selected project. The panel can also auto-fire its AI box once per chain (see ALGORITHMS section 17 — Critical Chain AI Box) when an API key is configured.
Cross-Project Dependencies
A list and an Add form below the matrix.
Dependency violations
When at least one declared dependency has the upstream forecast past the downstream target, a red alert box lists each violation: PROJ_A is blocked by PROJ_B — upstream finishes N days after PROJ_A's target.
Declared dependencies
A list of every upstream → downstream statement with optional description and a Remove button.
Add dependency form
Three controls:
- Upstream (blocks) — dropdown of registered project keys.
- Downstream (blocked by) — dropdown.
- Description — optional human-readable reason.
Plus a + Add button.
Cascade rules
When a dependency violation fires:
- The downstream project is flagged as blocked, recording which project blocks it, when the upstream finishes, and how many days it is blocked.
- Its health is raised to At Risk if it was Healthy; left as Critical if already worse.
- If the upstream project itself has negative slack, the downstream's slack becomes
min(downstream, downstream + upstream)so the late chain propagates: a 10-day-late upstream eats 10 days off the downstream's slack.
Removing a dependency clears the violation flag in the next analysis pass.
Empty / loading / error states
- No projects registered — the table still renders with its column headers and an empty body; the Add Project form above is where you start.
- Loading — sprints and issues stream in; a spinner is shown when the underlying fetch is in flight.
Cross-cutting modes
- Estimation mode — when every project shares one mode, the rollup uses that unit; when they differ, the unit suffix is dropped from the rollup Total Scope cell to avoid mixing units.
- Sprint mode on/off — per-project; the Capacity Mode options shift accordingly.
- Programs — selecting All projects aggregates every project at once; the Critical Chain section and other views use this to know whether to filter by the selected project.
How the numbers are computed
- Forecast — today + (remaining work ÷ average velocity) × sprint length in days. Velocity is the rolling average over the configured number of recent closed sprints; remaining is the sum of estimates on non-done issues.
- Slack —
target − forecastin days. When a project has no projected date (or no target), Slack is blank and the cell shows —. Negative when forecast is past target. - Health — Critical when slack < −14 days; At Risk when slack < 0 or utilisation > 120%; Healthy otherwise. Alerts do not influence health (they have their own column).
- Utilisation —
remaining work ÷ forecast capacity × 100. - Cascade slack propagation — when upstream slack is negative, downstream slack =
min(downstream, downstream + upstream). See the ALGORITHMS Project Allocation section (Allocation in Scenarios and Cascades subsection).
Effects on other parts of the app
- The Team Allocation Matrix here and the allocation popover in Team & Capacity write to the same store. Edits in either place propagate everywhere.
- Selecting a project in the main app's project picker filters every other tab to that project; selecting All projects switches the Critical Chain section to programme-aware mode across the whole portfolio.
- Nothing on this tab is committed to Jira. The registered programme (projects + allocations + dependencies) is saved to the app's Atlassian Forge storage (scoped to your Atlassian account, removed on uninstall); cross-portfolio "what if" modelling is done non-destructively in the What-If All Projects view and is never written back.
- The cascade rules feed the per-project warning badges shown across the Sprints and Critical Chain panels.
- Each project's forecast and slack feed the Dashboard's Top Open Risks widget through the Deadline at risk detector.